Why Do Low-End Laptops Struggle with Large Excel & Power BI Data?
Ever tried opening a huge Excel file or running a complex Power BI report on a basic laptop, only to watch it crawl or freeze up? You’re not alone. Many of us have felt the frustration of our computer chugging like it’s stuck in molasses when handling big data. In this post, we’ll break down why this happens and what you can do about it. We’ll keep it casual and clear—no overly techy jargon—so you can understand the issues and find solutions without a headache. Let’s dive into why large...

Ever tried opening a huge Excel file or running a complex Power BI report on a basic laptop, only to watch it crawl or freeze up? You’re not alone. Many of us have felt the frustration of our computer chugging like it’s stuck in molasses when handling big data. In this post, we’ll break down why this happens and what you can do about it. We’ll keep it casual and clear—no overly techy jargon—so you can understand the issues and find solutions without a headache. Let’s dive into why large datasets and low-spec hardware can be a tricky combination, and how to make things run more smoothly.
Check out some of our FREE templates and materials.
1. Big Data vs. Low-Spec Hardware: Why It’s a Struggle
Large Excel spreadsheets and complex Power BI reports put heavy demands on your laptop’s hardware. Low-end laptops (think budget models or older machines) often can’t handle these demands. Here’s a quick look at how different parts of your computer get strained:
Memory (RAM) – Big datasets eat up a lot of RAM. Excel has to load all those rows and formulas into memory, and Power BI Desktop loads data models into memory as well. If your laptop has limited RAM (4GB or 8GB), it can fill up fast. Once you run out of physical memory, the system starts using the hard drive as “virtual memory,” which is much slower. This is when you notice serious slowdowns. In fact, an average PC with 8GB RAM can be overwhelmed by a large Excel file, whereas 16GB or 32GB machines handle them better (though even they have limits). Running out of memory leads to freezes and random weird behavior in Excel– it’s not a strict limit being hit, but the system can’t keep up when so much data is in play.
Processor (CPU) – The CPU is your computer’s brain. Complex Excel calculations or Power BI data transformations make the CPU work hard. Low-end laptops often have entry-level processors or fewer cores, which means they can only do so much at once. Excel was built with many single-threaded operations (working on one task at a time), so high clock speed (raw GHz) helps for heavy formulas. Power BI can use multiple CPU cores better (for example, processing different columns or visuals in parallel), so having more cores is beneficial. On a low-spec machine with a 1 GHz dual-core CPU, you’ll max it out easily, whereas a modern 8-core CPU might handle the same task at only 5% usage. In short, budget CPUs get overwhelmed by the workload from large Excel models or Power BI reports.
Storage Speed (Disk) – Ever notice how long it takes to open or save a large Excel file? Part of that is your drive speed. Low-end laptops might use older hard disk drives (HDD) or cheap eMMC storage, which are slow compared to modern Solid-State Drives (SSD). When dealing with big files (hundreds of MBs or more), a slow disk becomes a bottleneck: loading data takes ages and if the system resorts to swapping to disk due to low RAM, an HDD will make everything crawl. An SSD, on the other hand, works at electronic speed (no moving parts) and can load data or handle virtual memory much faster. So a laptop with an SSD will feel much snappier than one with a spinning disk when crunching large datasets.
Graphics (GPU) – You might not think Excel or Power BI have anything to do with graphics, but they use graphics resources to render charts, dashboards, and the interface. Low-end machines usually have an integrated GPU (built into the processor) which shares memory with the system and is relatively weak. Power BI especially can benefit from a decent GPU for rendering visuals. If you have a lot of complex visuals or charts, an integrated graphics chip can struggle, which forces the CPU to pick up the slack for drawing things on screens. A dedicated graphics card (in higher-end laptops or desktops) has its own memory and can handle rendering, easing the load on the CPU. Many business laptops lack a dedicated GPU, and as a result, when you’re scrolling through a big Excel chart or an interactive Power BI visual, you might see lag or choppy updates. It’s not just gaming that benefits from a good GPU – data visuals do too!
Real-world example: One user described running a relatively modest dataset (36k rows, ~4MB of data with some complex queries) on a 4GB RAM, dual-core laptop. The poor machine was constantly at 100% CPU, memory, and disk usage, taking over an hour to refresh data and often getting stuck or crashing. This shows how even a mid-sized task can cripple a low-spec PC. Large datasets and complex reports essentially push every part of a low-end laptop to its limit – memory gets exhausted, the CPU maxes out, the disk thrashes, and the whole system struggles to keep up.
2. Power BI Desktop vs. Power BI Service: Performance on Weak Machines
Many people wonder why Power BI Desktop (the application you install on your PC) might run slowly on their machine, and whether using the Power BI Service (the cloud web service) would help. The key difference is where the heavy lifting happens:
Power BI Desktop runs on your computer. This means all the data processing, model calculations, and visual rendering are using your laptop’s CPU, RAM, and disk. If you’re on a low-end machine, a complex Power BI report can overwhelm it just like a big Excel file would. Microsoft’s official minimum requirements for Power BI Desktop are surprisingly low (4 GB RAM, 1 GHz CPU, etc.), but running on those specs is “painful and frustrating” in practice, as noted on. In other words, just because Power BI can run on a lightweight laptop doesn’t mean it runs well. If you have email, a web browser, or other apps open, a minimal-spec machine will buckle under the pressure.
Power BI Service (Cloud) runs on Microsoft’s cloud servers. When you publish a report to the Power BI Service and view it in your browser, a lot of the heavy computation (data queries, aggregations, etc.) is handled by the cloud backend. This means your local hardware isn’t doing all the work – good news for low-spec laptop users. For example, if you have a huge data model or running intensive calculations, the Power BI Service’s machines (which are much more powerful) handle that load in the cloud. However, your laptop is not completely off the hook: it still needs to run a web browser to display and interact with the report. If the report has many visuals or requires loading a lot of data into the browser, a weak laptop can still feel slow rendering it, or your browser might become sluggish. Network speed also comes into play – a slow internet connection can make the web-based report seem slow, even if the cloud is fast.
Why does the Service sometimes seem slower? There are cases where a report might actually run slower in the Service than on Desktop, especially with certain data setups. For instance, if you use DirectQuery (where visuals query a database live rather than using imported data), Power BI Desktop might pull data more directly (especially if the database is on your local network), whereas the Service has to reach out over the internet to query the data source, which can add latency. In one case, a report took 20 seconds on Desktop but nearly 2 minutes on the Service because it was waiting for a cloud database (Snowflake) on each query. The service also enforces things like security (Row-Level Security roles) which can add overhead in the cloud environment. For most typical scenarios though, if you have a truly underpowered laptop, offloading to the Service will generally improve the experience since the cloud does the number-crunching. It’s a bit like borrowing a friend’s supercomputer: your laptop just needs to show the results.
Bottom line: On a low-end machine, Power BI Desktop will likely struggle with large data models or complex reports because it’s limited by your hardware. The Power BI Service can alleviate some of that by using cloud resources, but it’s not a magic fix for everything – you may still hit slowness if your internet is slow or if the reports are very heavy to render. Ideally, use the Service for sharing and possibly consider cloud premium options (more on that later) if your hardware isn’t up to snuff. And whenever possible, do the data modeling and heavy queries in an environment with better hardware (even if that means a beefier desktop or a cloud VM) before pushing it to your poor little laptop.
3. Symptoms of Overload: How to Know Your Laptop Is Overwhelmed
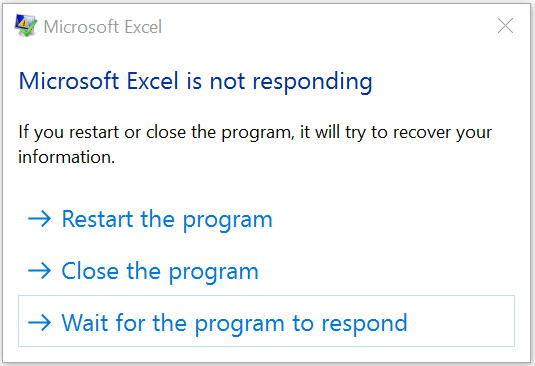
If you’ve ever encountered the dreaded “Microsoft Excel is not responding” popup, you know the feeling – your spreadsheet has effectively become frozen in time. When a low-end laptop is overloaded by a large Excel or Power BI task, it lets you know in not-so-subtle ways:
Freezing and Not Responding: You try to scroll or click, and the application just hangs. Excel might grey out with a “Not responding” message in the title bar, meaning it’s busy crunching away and can’t handle any new input. In Power BI Desktop, you might click a slicer or try to refresh data and see it lock up for a while. This freezing often happens when the system is maxed out on CPU or memory – the software isn’t truly “dead,” it’s just stuck waiting for the hardware to catch up.
Severe Lag and Slowness: Everything takes ages. A formula that usually calculates in a second might take minutes. Changing a single number or filter could have you staring at the spinning cursor or loading bar. Large Excel files may be slow to open or save (you click file open, then go get a coffee). In Power BI, switching between report pages or applying a filter might stutter or delay. Essentially, the response time is so slow that it disrupts your workflow.
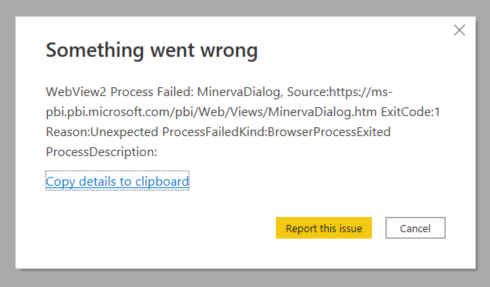
Crashes and Out-of-Memory Errors: In worst cases, the application might just give up. You could get an error saying something like “Not enough memory” or “Excel cannot complete this task with available resources.” Power BI might throw a memory allocation error or simply close unexpectedly if it runs out of resources. For example, an underpowered laptop running a heavy Power BI refresh might hit 100% memory and then crash or force Windows to shut the app. Crashes can also happen when the CPU overheats (common in thin laptops working overtime) or if the software hits a built-in limit (like Excel’s 32-bit 2GB memory cap).
Overall System Slowdown: It’s not just Excel or Power BI – your whole laptop might become sluggish. If you open Task Manager, you’d likely see CPU, memory, and disk usage at or near 100% during the heavy task. This can cause even simple actions like moving the mouse or switching windows to lag. Your fan might be roaring as the laptop tries to cool itself. In some cases, you might even get system warnings or have the machine throttle performance to cope with the heat.
Visual Glitches or Incomplete Rendering: Sometimes, when the graphics capabilities are maxed out, you’ll see odd behavior like charts not fully drawing, Power BI visuals showing “working on it…” for a long time, or a graph that appears with chunks missing until the system catches up. This is a sign the GPU/CPU combo is struggling to render the content in real time.
If you’re noticing these symptoms regularly when dealing with large Excel files or Power BI reports, it’s a clear sign your hardware is at its limits. Don’t worry, though – next we’ll look at ways to alleviate these issues.
4. Best Practices to Improve Performance on Low-Spec Machines
The good news is, you can often make Excel and Power BI run better on your existing hardware by using some smart techniques. Think of it like tuning up a car to get a bit more mileage. Here are some technical best practices to ease the burden:
Reduce the Data Size: Do you really need all those rows and columns? Often, reports include more data than necessary. Filter out or aggregate data before loading it. In Power BI, use Power Query to apply filters (e.g., maybe you only need the last 2 years of data, not 10 years). In Excel, consider using features like Data Model or Power Query to pull in only what you need for analysis. By trimming the fat, you give your laptop less to chew on. One Power BI support engineer put it simply: limit the data size, remove unnecessary columns, and you’ll likely see an improvement in performance.
Optimize Calculations and Formulas: Inefficient formulas can kill performance. In Excel, avoid super volatile functions (like OFFSET, INDIRECT) whenever possible – they recalc everything all the time. Use helper columns to simplify formulas (breaking a complex formula into steps can sometimes speed it up). If you have massive arrays or lookups, consider if a PivotTable or Power Pivot data model would be faster. Also, turn off automatic calculation temporarily when making a lot of changes, and hit calculate (F9) manually when ready – this prevents Excel from recalculating on every minor edit. In Power BI, pay attention to DAX measures – a poorly written measure or too many calculated columns can be slow. Use the VertiPaq Analyzer or performance analyzer in Power BI to find slow queries if you’re advanced. In simpler terms, try to let the database or data source handle heavy calculations before the data gets to Excel/Power BI. And check if any Excel add-ins are running; sometimes third-party add-ins can slow things down or use extra memory – disable ones you don’t need.
Break Things into Smaller Chunks: Instead of one monster Excel workbook, can you split data into a few smaller, linked files? Or use multiple sheets and only open the heavy one when needed? In Power BI, if one report is extremely large or complex, consider splitting it into a few focused reports (maybe by subject area) and use the Power BI Service to link dashboards together. Smaller models load faster and put less strain on your machine.
Use 64-bit Software: This is a big one for Excel especially. The 32-bit version of Excel has a hard limit of about 2 GB of memory usage. If you’re working with large data and you have a 64-bit Windows OS, make sure you install 64-bit Office. That way, Excel can use as much RAM as your system has. This alone can prevent those “Out of memory” errors on a 8GB+ machine where 32-bit Excel would choke. Most Office 365 installs nowadays default to 64-bit, but double-check. Similarly, ensure Power BI Desktop is the latest version (it’s 64-bit only by default). Essentially, use software versions that can leverage your hardware fully.
Simplify Visuals and Enable “Extracts”: For Power BI, too many visuals on one page can drastically slow things down (each visual might run a query or do some calc). Try limiting the number of visuals or charts per report page to a reasonable amount. Also, prefer simpler visuals over super fancy custom visuals when performance is key – some custom visuals are not optimized for speed. Another trick: if your data is huge, see if you can use aggregations or summary tables. Power BI has features where you can pre-aggregate data to a higher level and let details be on-demand. And if using Excel, turning off things like animated page transitions or excessive conditional formatting can help a bit (those eat resources when scrolling).
Close Other Programs: This sounds obvious, but it’s worth stating: when you’re about to do heavy data work, save your Chrome tabs and close the browser, shut down that video streaming or any other RAM-hogging programs. Give Excel or Power BI as much of the pie as possible. Your low-end laptop might manage a heavy task if it’s not also running 10 other things. Also, check your system tray – sometimes background apps (like cloud sync, antivirus scans, etc.) kick in and steal resources at the worst times. Pausing OneDrive sync or scheduling virus scans for off-hours can free up a bit of performance headroom.
Use Efficient File Formats: If you’re working in Excel, consider saving large workbooks as .xlsb (Excel Binary) format. The binary format often loads and saves faster and can reduce file size compared to the standard .xlsx. It can make a notable difference for very large files. For Power BI, if you have a large data model you refresh often, see if using Power BI Dataflows or an imported dataset on the service could be more efficient (so your Desktop file is just connecting to an already processed dataset).
By implementing these best practices, you’re essentially lightening the load on your laptop. Less data to handle, fewer calcs to compute, and smarter use of resources means even a low-spec machine can punch above its weight. It might not turn your $300 budget laptop into a supercomputer, but it can make the difference between constant frustration and getting the job done.
5. Hardware Recommendations: What to Look for in an Upgrade

If you regularly work with large datasets, investing in better hardware can save you a lot of time (and sanity). You don’t necessarily need a super expensive workstation, but there are a few key specs to focus on if you’re shopping for a new PC or upgrading:
RAM (Memory): This is arguably the most important for Excel and Power BI. More RAM = better for heavy data tasks. We recommend at least 16 GB for serious work with large files, and 32 GB if your budget allows (especially if you multitask or use very large data models). With plenty of RAM, your laptop can store all the data in fast memory without hitting the slow disk as often. Avoid 4GB machines for this kind of work; even 8GB can be marginal if you’re working with tens of millions of rows or very complex analysis. Luckily, RAM is one of the more affordable upgrades on a desktop, though on many laptops it might be fixed – so choose a model with higher RAM from the start if possible.
CPU (Processor): Look for a modern multi-core processor. A mid-range to high-end Intel Core i5/i7 or AMD Ryzen 5/7 will give you a solid combination of good single-thread speed and multiple cores for parallel tasks. Power BI can utilise 4+ cores effectively, and Excel can use multiple threads for worksheet recalculation (though diminishing returns after a handful of cores). Don’t get too hung up on core count alone – for Excel’s calculations, a fast core speed (measured in GHz) matters a lot too. But generally, any recent 4-core or 6-core CPU (or more) with a decent clock (3+ GHz) should handle most tasks well. Avoid the ultra-budget CPUs (like older Celerons, Pentiums, or low-end Athlons) for heavy data work – they will limit you. Aim for at least an Intel i5/Ryzen 5 class processor or above.
Storage Drive (SSD vs HDD): Insist on an SSD (Solid State Drive). This is non-negotiable for a good experience. An SSD will dramatically improve loading times for big files and make virtual memory swaps much faster. Many low-end laptops still cut costs with older HDDs – avoid those if you can. Also, consider capacity: large datasets and backup files can eat space, so having a 512 GB or 1 TB SSD is wise if you work with lots of data (especially if you use Power BI as it can create cache files, etc.). If you end up with a smaller SSD, you might need an external drive for storage, but try to keep active data on the SSD for speed. In short: SSD = good 👍, HDD = 😢 (only use as secondary storage if at all).
GPU (Graphics Card): While not as critical as RAM/CPU for data tasks, a dedicated GPU can help, particularly for Power BI. If you’re buying a laptop and have the option for one with an entry-level dedicated GPU (like an NVIDIA GeForce or similar) it can offload the rendering of charts and visuals from your CPU. This is more important if your reports have lots of visuals, maps, or if you do any 3D charts or use Power Map in Excel. A dedicated GPU also typically comes with its own memory, which can keep visual data without stealing from system RAM. However, GPUs in laptops can drive up cost and battery use. If your work is mostly Excel number-crunching, a high-end GPU is not necessary – integrated graphics will do, just possibly a tad slower in rendering. On desktops, adding even a modest graphics card can help with display smoothness on big dashboards. It’s a nice-to-have for analysts but prioritize CPU/RAM first.
Other Considerations: Don’t overlook the cooling and build of the laptop. Thin, fanless ultrabooks might thermal-throttle (slow down when hot) under sustained heavy use. A laptop with a decent cooling system or a mid-size form factor might sustain performance longer. Additionally, if you work with server databases or cloud data, having a reliable network card/Wi-Fi matters (or use Ethernet). And as the Senturus guide suggests, sometimes a desktop machine can offer better specs for the price – maybe your organisation can provide a desktop for heavy lifting and a lighter laptop for travel, combining the best of both.
In summary, an ideal setup for handling large Excel and Power BI tasks would be something like: 16GB+ RAM, a fast multi-core CPU, an SSD, and possibly a dedicated GPU. This kind of hardware ensures smoother performance and reduces the chance you’ll be stuck watching the spinning wheel of doom.
6. Cloud to the Rescue: Offloading Heavy Work to Online Services
What if upgrading hardware isn’t an immediate option? Cloud-based solutions can help by doing the heavy lifting on your behalf. Microsoft has several offerings that let you leverage powerful servers in lieu of your low-end laptop for big data processing:
Power BI Premium (and Premium Per User): Power BI Premium is essentially buying dedicated capacity in the cloud for your organization. With Premium, your published datasets and reports run on isolated, high-performance servers managed by Microsoft. This means you can have much larger models (tens of gigabytes) and heavier usage without hitting the limits of shared capacity. Even if you don’t have the super expensive full Premium capacity, the Premium Per User license can unlock some of these benefits on a per-user basis at lower cost. The idea is that instead of your tiny laptop handling the data model, a beefy cloud server does it. Premium also adds features like incremental refresh (so you don’t reload all data every time) and other optimizations for large datasets. If your Excel is choking on data, consider if that data can be moved into a Power BI Premium dataset – then use cloud processing and maybe connect Excel to it via PivotTables (using Power BI datasets as a source). It’s like renting a supercomputer only when you need it.
Azure VMs / Cloud Virtual Machines: If you need a full environment to run Excel or Power BI Desktop but your physical machine isn’t up to task, one strategy is to use an Azure Virtual Machine (or Amazon AWS, etc.) with strong specs. For example, you could spin up an Azure VM with 32GB RAM and a fast CPU, remote into it, and run Excel or Power BI there. All the computation happens on the VM; your laptop just streams the display. This can be great for occasional heavy crunching – you pay for the VM only when you use it (hourly), and you get the power of a high-end workstation. Some companies provide a virtual desktop infrastructure for analysts for this reason. Similarly, Azure offers Analysis Services and the new Fabric components where you can host models in the cloud. The key point: cloud VMs or services let you bypass your local hardware limitations by leveraging cloud hardware.
Excel Online / Office 365 Online: Using Excel in a web browser (Excel Online, part of Office 365) might offload some tasks to Microsoft’s servers. However, note that Excel Online has some limitations and isn’t identical to desktop Excel in features. For large data though, Excel Online isn’t a magic bullet – it’s still likely constrained and might even refuse very large files. That said, one advantage is collaboration and autosave; your work is continuously saved to the cloud (OneDrive/SharePoint), so you might avoid data loss if something crashes. Microsoft has been adding features like “Workbook Statistics” and performance checks in Excel for web, and they can optimize certain operations on the server side. But if your workbook is extremely heavy, you might instead use Power BI or other cloud-based tools which are more geared for big data.
Other Cloud Tools: If Excel and Power BI are struggling, you might consider other cloud-based data platforms. For instance, using a database or data warehouse (like Azure SQL, Azure Synapse, etc.) to do the heavy data crunching and then pulling in only summary results to Excel. Or using a specialized big data spreadsheet like the one from Row Zero (as their blog suggests) or Google BigQuery with connected sheets. The cloud is good at scaling up processing power on demand. Power BI Dataflows is another feature – you can perform Power Query transformations in the cloud, so your laptop just grabs the already prepped data. The overall theme is to shift as much computation as possible off the local machine and onto cloud services that are designed to handle it.
In practice, many organizations adopt a hybrid approach: do initial data processing on a server or cloud service, then use Excel/Power BI locally for final analysis. For example, aggregate 100 million records down to a summary in a database, then export a 100k-row result to Excel for the team to play with. By leveraging cloud and server resources, you’re not fighting against the limits of your low-end laptop alone.
7. Organizational Strategies: Shared Infrastructure and User Training
Handling large datasets isn’t just about individual hardware or software tweaks – it often requires a broader strategy at the organizational level. If your company or team frequently deals with big data, here are some approaches to consider:
Shared Data Infrastructure: Instead of every analyst working with massive raw data on their personal laptop, set up a centralized data source or service. This could be a data warehouse, a SQL database, or a centrally maintained Power BI dataset that everyone can query. By having a single, well-optimized data model on a server (or in the Power BI Service), individuals don’t need to each import the 10 million rows into their own Excel. They can connect to the shared source and pull only the slices they need. This not only improves performance (servers are usually more powerful, and the heavy lifting is done once), but also ensures everyone is working off the same numbers (single source of truth). For Power BI, this might mean using Power BI shared datasets or Analysis Services models that users can connect to rather than duplicating large models in every report.
Enterprise Tools and Premium Capacities: Organizations might invest in enterprise-grade tools like Power BI Premium (as mentioned) or even Power BI Report Server (an on-premises server for Power BI reports) to handle large reports. Another example is using Analysis Services Tabular models – essentially the engine behind Power BI – running on a robust server. Then Excel users can connect to these via pivot tables (using Analyze in Excel feature for Power BI datasets) instead of loading data locally. By spending on a beefy server or cloud service, the organization can relieve all the low-end client machines from doing heavy crunching. It’s a trade-off of centralized power for better experience for all users.
Hardware Provisioning: Ensure that employees who regularly work with large data are given appropriate hardware. It might be cost-effective to have a pool of high-performance machines (or virtual desktops) available for those who need them. For instance, a finance team dealing with large Excel models might share a powerful desktop when doing the end-of-month processing, rather than each struggling on a lightweight laptop. Some companies also have policies where certain roles get upgraded laptops (e.g., 16GB+ RAM for analysts). While not everyone needs a high-end computer, identifying who does and equipping them properly is key. Remember, the cost of a faster PC can easily be justified by the time saved and productivity gained (and fewer coffee breaks waiting on spreadsheets!).
User Training and Best Practices: Often, performance issues arise not just from “bad hardware” but from sub-optimal use of the tools. Training users on efficient Excel and Power BI practices can go a long way. For example, teaching an Excel user about using the Data Model and Power Query to handle large datasets instead of trying to jam everything into worksheets can be a game-changer. Educating staff about things like avoiding volatile Excel functions, keeping formulas efficient, using filters on pivot tables, or in Power BI, how to create proper relationships and not use overly complex DAX when a simpler measure would do – these can greatly improve performance. Training might also include demonstrating the features of Power BI Service (so users know that a heavy report can be published and run in the cloud) or showing how to analyze resource usage (so they realize when they need to request more memory or such). In short, knowledge is power: an informed team will make the most of the tools and hardware they have.
Workflow Adjustments: Sometimes, splitting tasks or adjusting processes can mitigate hardware issues. For example, if a huge Excel file is only slow when doing a full refresh of data, maybe schedule that refresh during lunch or overnight, and work with a smaller subset during the day. If multiple people need to work on the same data, maybe move that data to a shared database or Google Sheets to leverage collaborative editing and lighten the load on individuals. Think creatively – the goal is to avoid a scenario where every person is individually processing the same heavy data on underpowered machines. Coordinating efforts and centralizing heavy tasks can yield efficiency.

By implementing these organizational strategies, companies can prevent a lot of headaches. It’s about creating an environment (both technically and through training) where low-end laptops aren’t left alone to do the impossible. Instead, you leverage collective resources and smarter workflows to handle large data smoothly.
Conclusion
Dealing with large datasets in Excel and Power BI on a low-end laptop can feel like pushing a boulder uphill. The hardware struggles because tasks demand more memory, CPU power, and faster storage than budget machines typically have. We see it manifest as sluggish performance, freezing apps, and occasional crashes – none of which are fun when you’re on a deadline. But understanding why it happens is the first step to finding solutions.
By optimizing your approach (both in how you use the software and possibly upgrading hardware where you can), you can significantly improve the experience. Maybe that means cleaning up your data and formulas, boosting your RAM, switching to an SSD, or offloading heavy crunching to the cloud. Often it’s a combination of all the above. And if you’re in an organization, looking at the bigger picture – shared infrastructure and proper training – can turn a painful process into a smooth one for everyone.
Remember, you don’t need to be an IT guru to apply these insights. Keep things simple: more memory, less unnecessary data, and use the right tool for the job. With a few adjustments, even a modest laptop can handle surprisingly large tasks. And for those truly gigantic projects, you now know there are cloud and enterprise options out there to help shoulder the load. So next time you open that massive Excel file or refresh that Power BI report, you’ll be better prepared – and your laptop will thank you!