
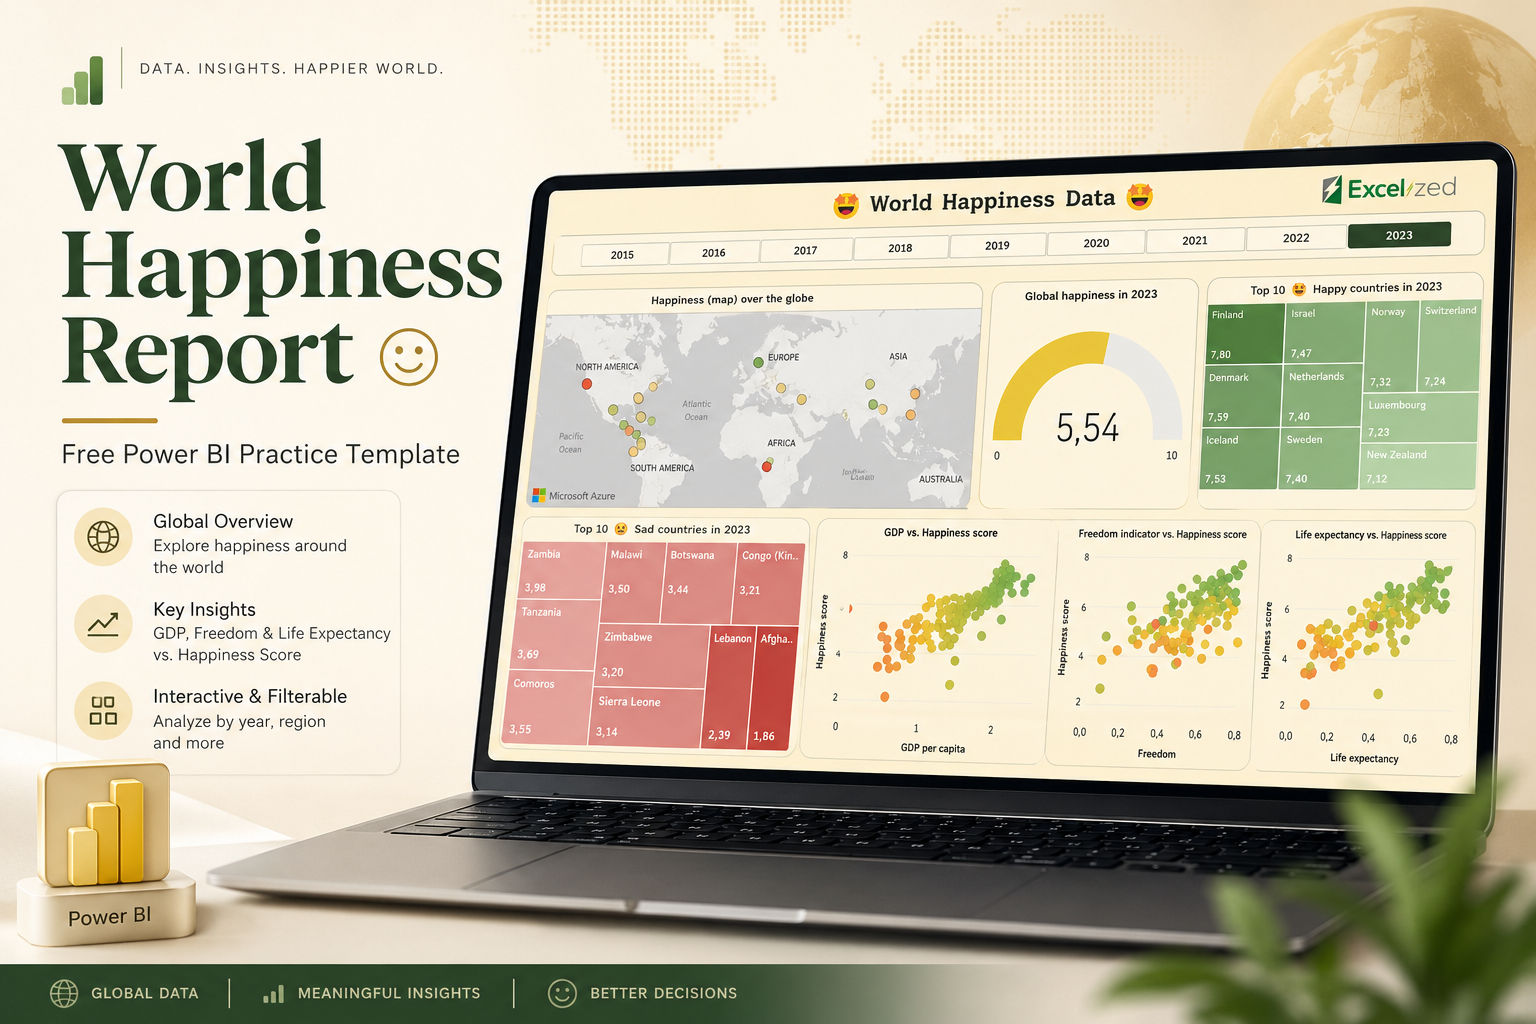

Power BI World Happiness Practice Template
Practice Power BI report design and data storytelling with an interactive World Happiness dashboard.
Best for
- Power BI beginners and intermediate learners
- Students, analysts, portfolio builders, and dashboard designers
What you get
- Maps, KPI cards, treemaps, gauges, scatter plots, and year filters
- Country and regional comparisons across multiple years
- Views that relate happiness scores to GDP per capita, freedom, and life expectancy
- A ready-made report for study, experimentation, or portfolio inspiration
Why it helps
Explore a realistic analytical story while learning how slicers, visual interactions, and comparative layouts work together.
Compatibility & requirements
Microsoft Power BI Desktop is required to open and edit the report.
Data source
The practice report uses World Happiness data sourced from Kaggle.com.
License
Redistribution is not permitted.
€0.00Price
