Build a Profit & Loss (P&L) report in Power BI — end-to-end from CSVs
This post walks through the exact setup shown in your screenshots: folder-based CSV ingestion in Power Query, a tidy star schema, an FX bridge for currency conversion, a P&L layout table for the matrix, and a simple report page with monthly columns and KPI cards. No fluff—just what’s in your files. Check out some of our FREE templates and materials. PRACTICE MATERIAL BELOW!👇 What we’ll build (at a glance) Tables : dimDate, dimAccount, factGL, dimFX, dimPnL, plus your Calculations/KPI...

This post walks through the exact setup shown in your screenshots: folder-based CSV ingestion in Power Query, a tidy star schema, an FX bridge for currency conversion, a P&L layout table for the matrix, and a simple report page with monthly columns and KPI cards. No fluff—just what’s in your files.
Check out some of our FREE templates and materials.
PRACTICE MATERIAL BELOW!👇
What we’ll build (at a glance)
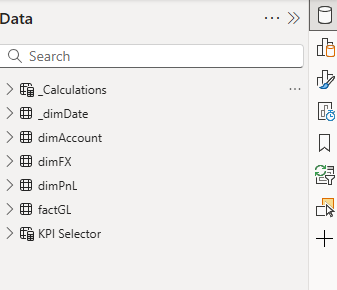
Tables: dimDate, dimAccount, factGL, dimFX, dimPnL, plus your Calculations/KPI Selector.
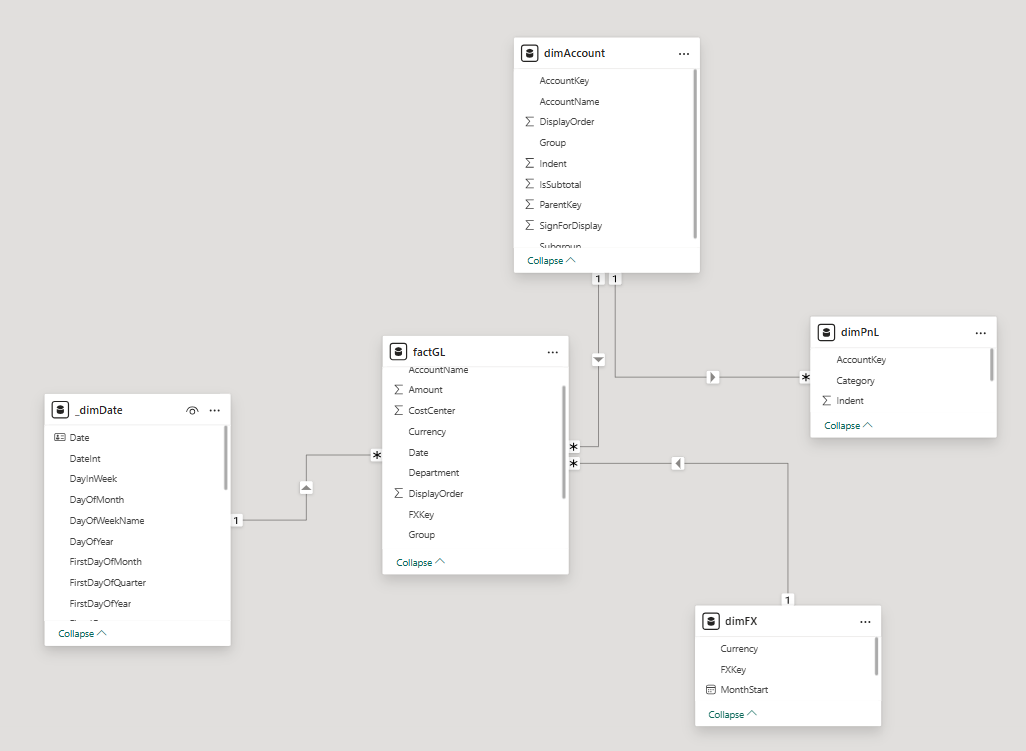
Relationships (as in model view)
_dimDate[Date] → factGL[Date] (one-to-many, single direction)
dimAccount[AccountKey] → factGL[AccountKey] (one-to-many, single direction)
dimFX[FXKey] → factGL[FXKey] (one-to-many, single direction)
dimAccount[AccountKey] → dimPnL[AccountKey] (to enrich P&L grouping)
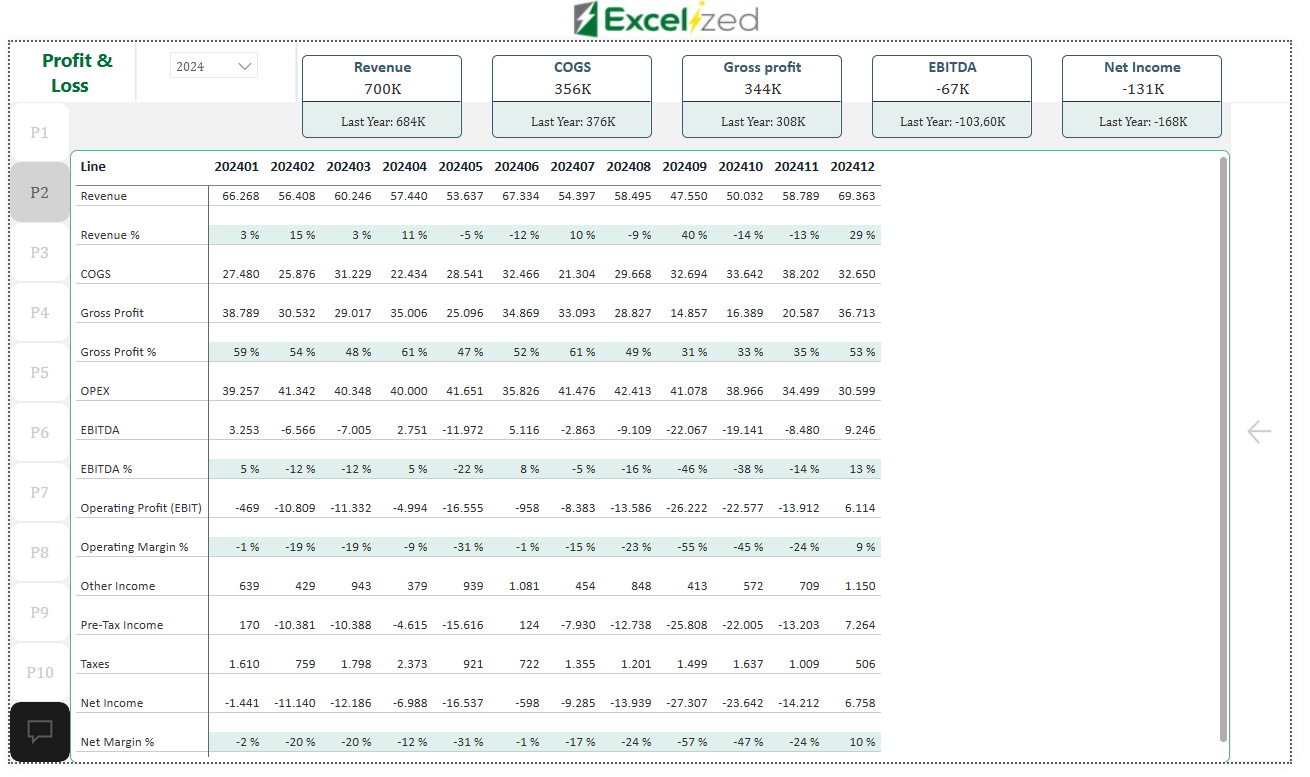
Visuals: a matrix with Line rows and YYYYMM columns (202401…202412), and KPI cards for Revenue, COGS, Gross Profit, EBITDA, Net Income (incl. “Last Year” on the card subtitle).
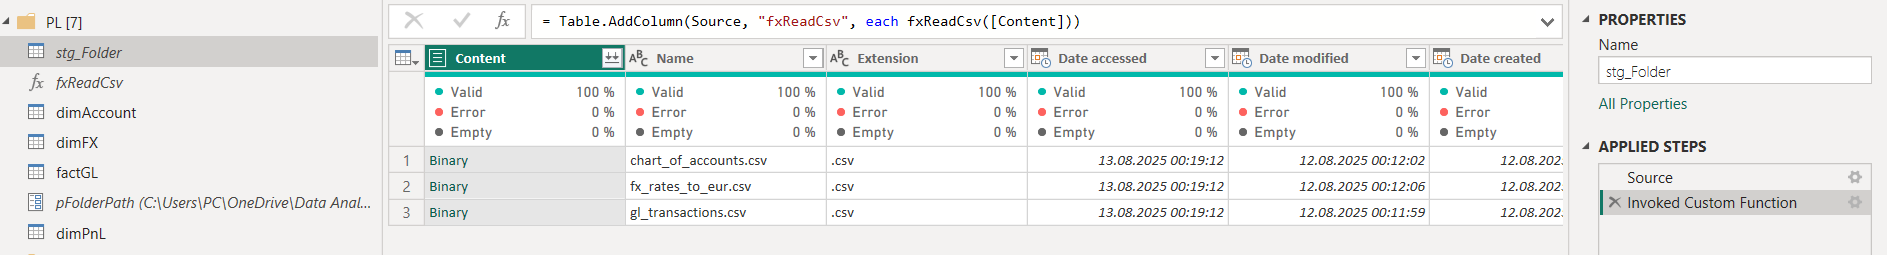
1) Stage your CSVs (folder query)
Your stg_Folder lists the three files used (as in the screenshot):
chart_of_accounts.csv
fx_rates_to_eur.csv
gl_transactions.csv
You’re invoking a helper function fxReadCsv against the Content column.
2) Power Query – table queries (exact code)
2.1 dimAccount (Chart of Accounts)
Reads from chart_of_accounts.csv and types critical columns.
2.2 dimFX (FX to EUR with MonthStart + key)
Adds MonthStart and a composite FXKey.
✅ Note: FXKey must match the exact format used in factGL. Keep the "01/MM/yyyy" pattern consistent on both sides.
2.3 factGL (transactions + CoA attributes + MonthStart + FXKey)
Joins CoA for display fields, adds MonthStart and FXKey.
⚠️ Caution: The last line uses "01/MM/yyy". If your dimFX uses "01/MM/yyyy", make them identical to avoid key mismatches.
2.4 dimPnL (layout table for the matrix)
This is the scaffold that drives the P&L lines, indentation, and whether a row is Amount or Percent.
2.5 dimDate (via fxCalendar)
Covers 2011–2025 with standard date attributes.
3) Model wiring (as in your diagram)
From table/column | To table/column | Purpose |
_dimDate[Date] | factGL[Date] | time slicing for matrix & KPIs |
dimAccount[AccountKey] | factGL[AccountKey] | account attribution |
dimFX[FXKey] | factGL[FXKey] | currency conversion key |
dimAccount[AccountKey] | dimPnL[AccountKey] | map detail rows to P&L lines |
Keep filter direction single from dimensions to fact (that’s how your screenshot shows it).
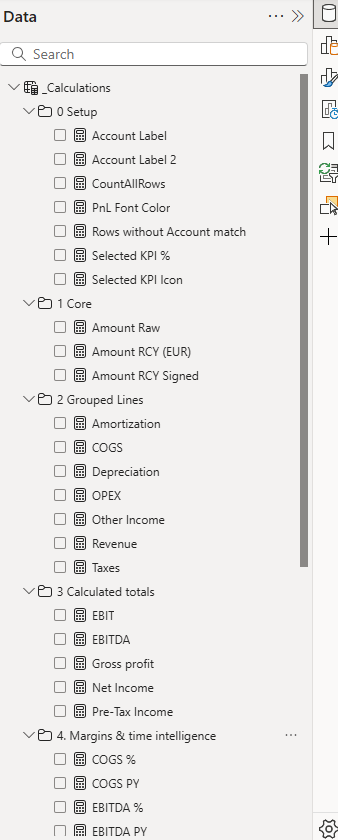
4) Measures & folders (per your _Calculations pane)
You’ve grouped measures into:
0 Setup (labels, icons, font color, selection helpers)
1 Core (Amount Raw, Amount RCY (EUR), Amount RCY Signed)
2 Grouped Lines (Revenue, COGS, OPEX, Depreciation, Taxes, Other Income…)
3 Calculated totals (EBIT, EBITDA, Gross profit, Net Income, Pre-Tax Income)
4 Margins & time intelligence (e.g., COGS %, EBITDA %, PY variants)
Tip: keep the naming and folder structure exactly as above so the matrix and KPI cards stay clean.
5) Report page setup
Slicers: Year (from _dimDate), optional KPI selector.
Cards: bind your five KPI measures (Revenue, COGS, Gross Profit, EBITDA, Net Income). The subtitle shows the “Last Year” variant.
Matrix:
Rows: dimPnL[Line] (use Indent for stepped layout / formatting).
Columns: _dimDate[MonthnYear] to get 202401…202412 like in your screenshot.
Values: your measure that returns either amount or % based on ValueType.
Formatting: shade percent rows, bold subtotals (e.g., Revenue, COGS, Gross Profit, EBITDA, Net Income).
6) Gotchas to double-check
FXKey format must match in factGL and dimFX (Currency|"01/MM/yyyy").
Data types: Date columns are typed as date, numeric as number/Int64.
Sign handling: SignForDisplay from CoA exists—use it consistently in your measures when you show costs as negatives.
Layout vs. accounts: dimPnL[AccountKey] is null for calculated lines (margins/totals) and filled for detail lines.
Dataset for practice and download in the Downloads section!
Do you need a Power BI P&L template that you can modify to your needs? Just with a slight adjustment to the quick and efficient reporting. Check it out.