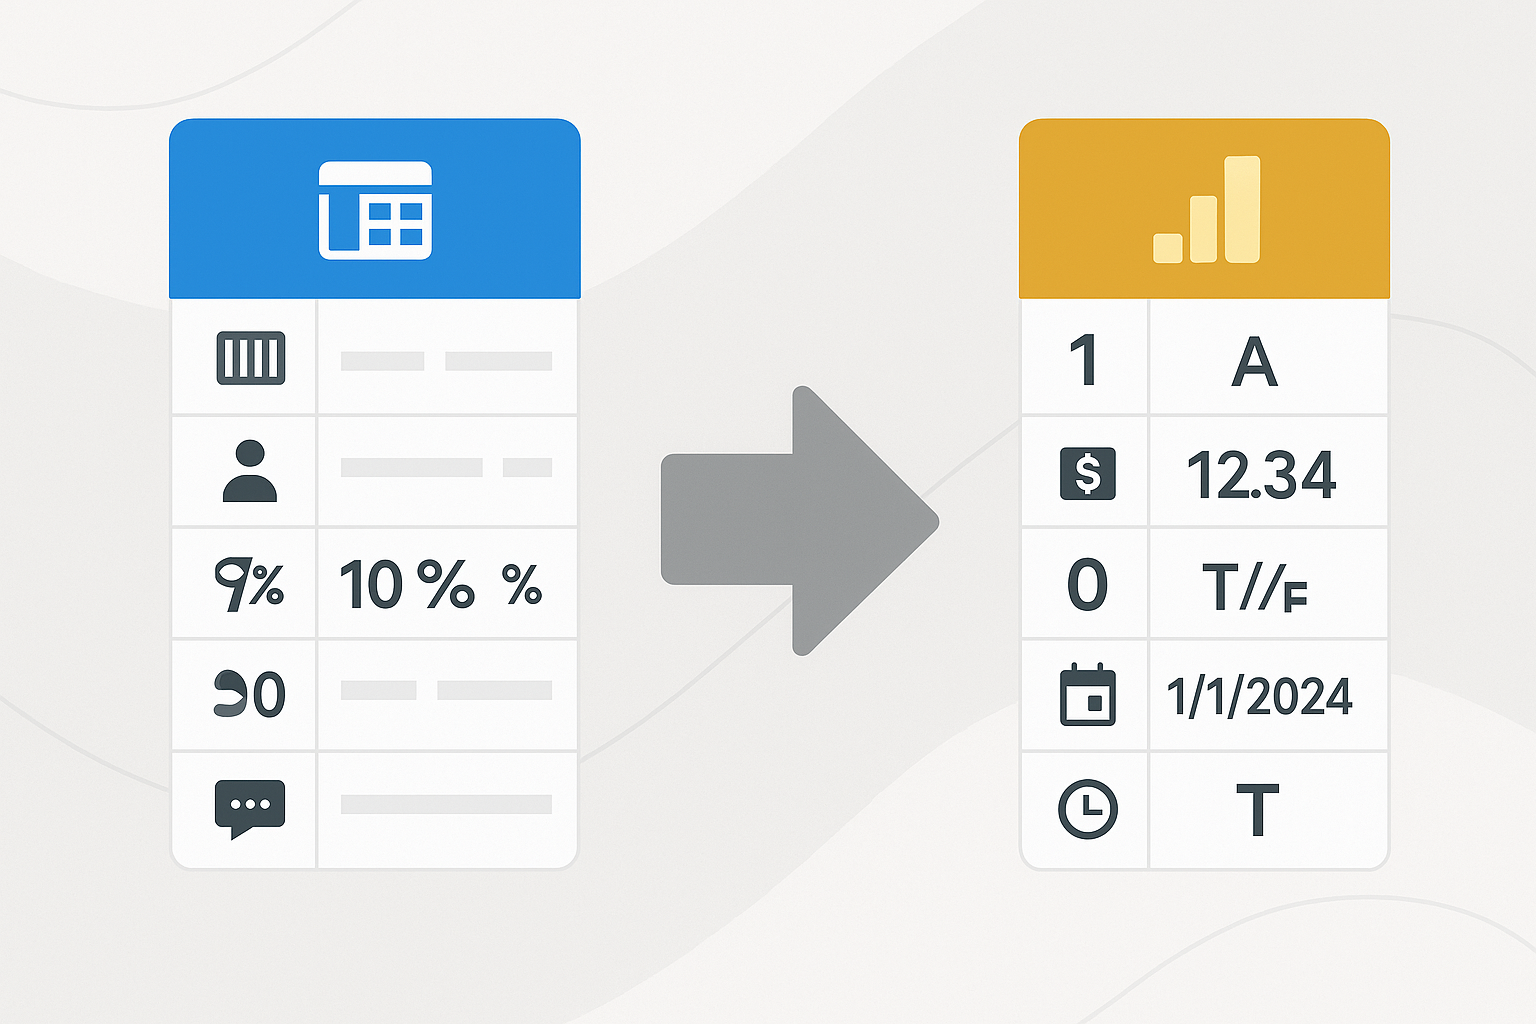
Data Types in Power Query vs. Data Types in Power BI’s Table View (Canvas)
Hook: If your model “mysteriously” changes numbers, breaks relationships, or sorts months alphabetically—blame data types. What we’ll cover: where to define types (and why), the safest order of operations across the ETL chain, Power Query vs. Model vs. Table View, special cases (DirectQuery, currency, duration), and concrete, copy-paste examples. 1) Why data types matter (and where they live) Power Query (PQ): Data shaping stage. Types here affect folding, transformations, and downstream...

Hook: If your model “mysteriously” changes numbers, breaks relationships, or sorts months alphabetically—blame data types.
What we’ll cover: where to define types (and why), the safest order of operations across the ETL chain, Power Query vs. Model vs. Table View, special cases (DirectQuery, currency, duration), and concrete, copy-paste examples.
1) Why data types matter (and where they live)
Power Query (PQ): Data shaping stage. Types here affect folding, transformations, and downstream semantics.
Model (Data/Model view): The semantic contract: the type the engine stores and relationships/aggregations rely on.
Report/Table View (Canvas): Mostly formatting and user-facing display. Changing “type” here often means changing format, not the underlying storage type.
Rule of thumb:
Define the correct storage type as early as possible in Power Query, confirm it in the Model, and use the Report/Table View for display formatting only.
2) The safe order of operations (end-to-end)
Source system (SQL/SharePoint/CSV): If you can, stabilize types at source (e.g., SQL view with CAST/CONVERT).
Power Query: Apply type steps immediately after column creation (often right after the navigation step). Avoid “Changed Type” scattered everywhere—group them intentionally.
Model: Double-check the resulting types; set data category (e.g., “City”, “Web URL”), summarization, format strings, and relationships.
Report/Table View: Use format (e.g., % with 2 decimals) and display units. Do not rely on the report layer to “fix” a wrong type.
Pro tip: When PQ auto-inserts Changed Type, keep one consolidated step (or a few logical blocks), not 12 micro-steps.
3) Power Query: practical patterns
Set types early, and set them explicitly. Here’s a compact, readable pattern:
let
    Source = Csv.Document(
        File.Contents("C:\Data\DataTypes_Demo.csv"),
        [Delimiter = ",", Columns = 10, Encoding = 65001, QuoteStyle = QuoteStyle.Csv]
    ),
    Promoted = Table.PromoteHeaders(Source, [PromoteAllScalars = true]),
    // One clear place to define types
    Typed = Table.TransformColumnTypes(
        Promoted,
        {
            {"InvoiceID", Int64.Type},
            {"Customer", type text},
            {"Amount_Decimal", type number},
            {"Amount_FixedCurrency", type number},
            {"DiscountPct", type number},
            {"IsPaid", type logical},
            {"InvoiceDate", type date},
            {"InvoiceDateTime", type datetime},
            {"Duration_Hours", type number},
            {"Notes", type text}
        },
        "en-US"  // locale matters for decimal/comma
    ),
    // Convert % from 0–1 if needed (or keep as 0–1 and format in model)
    WithPct = Table.TransformColumns(Typed, {{"DiscountPct", each _, type number}})
in
    WithPct
Locale tip: If your CSV uses comma decimals, set locale explicitly in Table.TransformColumnTypes or use “Using Locale…” in the UI to avoid 1,23 → 123 accidents.
Duration: In PQ, duration is its own thing (a time span). If you store “hours” as a number, keep it type number; if you need true duration, build it:
AddDuration = Table.AddColumn(WithPct, "Duration", each #duration(0, [Duration_Hours], 0, 0), type duration)
Dates: Normalize early. Split problematic text into date, time, datetime explicitly to avoid implicit conversions later.
4) Data/Model view: the semantic contract
Once the query loads:
Confirm Data Type (Whole, Decimal, Fixed decimal, Date, Date/Time, Text, Boolean).
Set Format (currency symbol, thousands separators, %).
Set Data Category (Country/Region, Web URL, Image URL, etc.)—helps maps, tooltips, and AI visuals.
Choose Default summarization (Sum, Average, Don’t summarize).
Validate relationships—wrong types can block proper cardinality.
Key difference:
Model type = storage semantics that drive relationships and DAX behavior. Report formatting = presentation only.
5) Report/Table View (Canvas): use for formatting—not fixing
You can switch format (e.g., show 0.15 as 15%) and display units (K, M), but that does not convert the underlying type. If it says “Text” in the model, visuals cannot aggregate it, regardless of a fancy format in the canvas.
When Table View matters: Quick visual checks, ad-hoc formatting, or verifying that data looks right. But if the type is wrong here, go back to PQ or Model and fix it at the root.
6) Special cases & common pitfalls
a) DirectQuery & Composite models
DirectQuery adopts types primarily from the data source. If the source says NVARCHAR for numeric content, Power BI may treat it as text.
Prefer typed SQL views (CAST/CONVERT) or Power Query with folding that pushes type coercion to the source.
Changing types after non-foldable steps may cause performance issues—keep type conversions early and foldable.
b) Currency vs. Decimal vs. Fixed Decimal
Decimal Number = IEEE 754 double (floating).
Fixed Decimal = Decimal fixed-point (128-bit) → better for money and financial precision.
Best practice: Store amounts as Fixed Decimal in the model; format with currency symbol. Do percentage either as 0–1 with % format or as 0–100 with “%” format—be consistent.
Pro tip: Don’t mix % as 0–1 in one table and 0–100 in another. Pick a standard.
c) Date/Time/Timezone
Power BI stores datetime without timezone. If your source contains offsets, normalize them at source or in PQ (e.g., convert to UTC or local).
Split date and time if you need consistent filtering and relationships.
d) Sorting & categorization
Text month names? Use a numeric column MonthNo and “Sort by Column”.
URLs or images? Set Data Category or visuals won’t behave as expected.
e) Blanks and error rows
Use coercion patterns to avoid errors bubbling up:
CoercedNumber = try Number.From([Amount_Decimal]) otherwise null
CoercedDate   = try Date.From([InvoiceDate]) otherwise null
And in DAX, prefer robust patterns, e.g.:
Measure := COALESCE( SUM ( 'Fact'[Amount] ), 0 )
7) Minimal, works-everywhere checklist
One clean “Typed” step in PQ per table (or per logical block).
Locale-aware type transformations.
Fixed Decimal for money; Whole/Int for keys; Date for dates.
Data Category set in the Model.
Report level for presentation only.
For DirectQuery, type at source or ensure folding.
8) Copy-paste snippets
Power Query: single step type block
Typed = Table.TransformColumnTypes(
    PreviousStep,
    {
        {"Key", Int64.Type},
        {"Amount", type number},
        {"IsActive", type logical},
        {"StartDate", type date},
        {"StartDateTime", type datetime},
        {"Label", type text}
    },
    "en-US"
)
Power Query: robust numeric coercion
Cleaned =
    Table.TransformColumns(
        PreviousStep,
        {{"Amount", each try Number.From(_) otherwise null, type number}}
    )
DAX: safe division & percent
Pct Sales = DIVIDE( [Sales], [Sales Target] ) Format result as Percentage in the Model (not only in the visual).
9) Try it now (sample data)
I’ve prepared a tiny CSV so you can test types end-to-end (import with Text/CSV in PQ and apply the patterns above):
10) Quick decisions matrix (what to do where)
I need relationships to work: Fix types in Power Query, confirm in Model.
Numbers display with wrong decimals or %: Keep the underlying type numeric; adjust Format in Model.
Data arrives as text numbers from CSV: Convert to number in PQ with locale.
DirectQuery returning text for numerics: Fix at SQL view, or ensure folding of type cast in PQ.
Month sort is wrong: Add MonthNo and “Sort by Column” in Model.
Bonus pro tips
Disable PQ’s auto type detection if it keeps guessing wrong; use a deliberate Table.TransformColumnTypes.
Keep keys as integers (not text) to improve relationship performance.
Create a Measure Table for measures (model cleanliness; not a type topic—but a maintenance win tied to consistency).
Document your type decisions in a README step or comments for handovers. (ah yeah, documentation... 😑)