Do's and No-Do's in Power BI: A Beginner's Guide
Getting started with Power BI can feel overwhelming, especially if you're new to data visualization tools. But don’t worry! This blog...

Getting started with Power BI can feel overwhelming, especially if you're new to data visualization tools. But don’t worry! This blog post will outline the essential dos and don'ts to help you confidently navigate your Power BI journey.
Do's: Getting the Basics Right
When you're kick-starting your Power BI experience, it's crucial to establish a solid foundation. Here are some essential do's to help you get going:
1. Do Organize Your Data
Before creating visualizations, clean and organize your data. Power BI thrives on well-structured information.
Use Descriptive Headers: Label your columns and rows clearly. Avoid generic titles like “Column1” or “Data3” as they make interpretation difficult.
Remove Duplicates: Check your dataset for duplicates, which can skew your analysis. Power BI has built-in tools to help you remove these easily.

2. Do Explore the Tool
Familiarize yourself with Power BI’s features. Experiment with the visuals and the layout options available.
Play with Visualizations: Don’t just stick to bar charts! Explore pie charts, line graphs, and even maps. Each visual type can tell a different story with your data.
Take Advantage of the Community: Power BI has a vast community of users. Check out forums, webinars, and blogs to learn new tips. The Power BI community can be an excellent resource for beginners.
3. Do Keep it Simple
Simplicity often leads to clarity. Make sure your data visualizations are straightforward to understand.
Limit Colors and Fonts: Too many colors can be distracting. Stick to a cohesive color palette that aligns with your brand or theme.
Choose a Clear Layout: Avoid clutter. A neat, organized dashboard will make it easier for you and your audience to absorb information.
No-Do's: Pitfalls to Avoid
To ensure you're getting the most out of your Power BI experience, here's a list of common mistakes you should avoid at all costs:
1. No-Do Ignoring Data Security
Data security should be your top priority when handling data. Be mindful of how you manage and share your reports.
Avoid Sharing Sensitive Information: Never include confidential data without proper permission. This could lead to compliance issues or breaches.
Use Row-Level Security (RLS): If you need to share your reports with different users, consider using row-level security to restrict their access to sensitive data.

2. No-Do Overloading Your Dashboard with Data
Having too much information on your dashboard can drown users in data. Remember, less is more.
Avoid Cramming Visuals: Limit the number of visuals and focus on the key metrics that matter the most. Each visual should serve a distinct purpose.
Use Drill-Down Features: Instead of showing everything at once, allow users to drill down into the information they're interested in.
3. No-Do Overcomplicating Your Queries
While writing complex DAX (Data Analysis Expressions) formulas may be tempting, simplicity is often your best friend.
Stick to Basic Calculations: Focus on the basics for your first few reports. Simple sum, average, and count functions are often all you need.
Learn as You Go: Don’t feel pressured to become a DAX expert overnight. As you grow more comfortable with Power BI, you can gradually incorporate more complex formulas.
Key Features to Leverage
While you’re getting a feel for Power BI, some features can significantly enhance your visualizations.
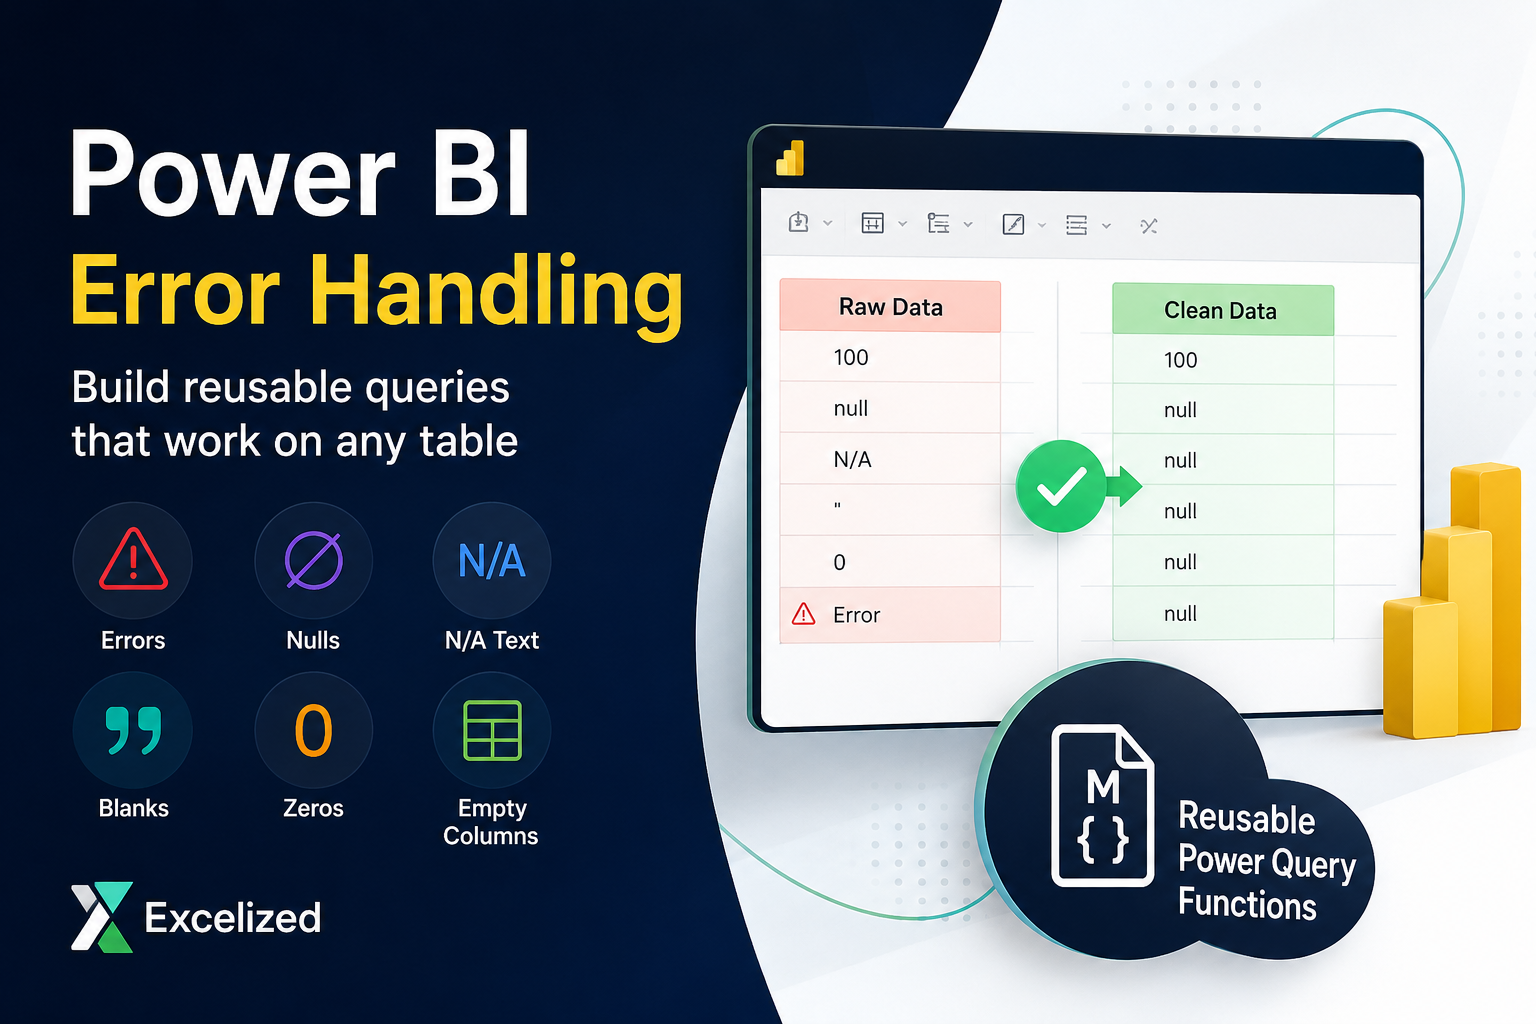
1. Use Power Query for Data Transformation
Power Query is a powerful tool that allows you to shape and refine your data before analysis.
Transform Data Easily: Use Power Query to clean your data, such as removing unnecessary columns or changing data types. This will lead to a better dataset from the start.
2. Optimize Performance with Aggregations
If you’re working with large datasets, pay attention to performance optimization.
Utilize Aggregation Tables: Instead of loading massive amounts of data, create summarized tables, which can significantly speed up your reports.
Reduce Data Model Size: The smaller the dataset, the faster your report runs. Remove any unnecessary data imported into Power BI.
3. Stay Updated on Power BI Features
Power BI constantly evolves, so keeping up with new features is essential.
Follow the Release Notes: Microsoft publishes regular updates, and each release notes document includes handy new features that can help you improve your dashboards.
Final Thoughts on Power BI Etiquette
As you embark on your journey with Power BI, keep these do's and don'ts in mind. Trust me, practicing good etiquette improves your skills and enhances your audience's experience.
Engage with Feedback: After sharing your dashboards, ask for feedback! Understanding how others perceive your work can help you improve it.
Be Curious: The beauty of Power BI lies in its vast capabilities—never stop learning or exploring new methods to visualize your data.
With these guidelines, you're now better equipped to tackle Power BI tools confidently. Good luck, and happy analyzing!