

From Data to Presentation: How to Combine Power BI and PowerPoint for Impactful Insights
- MirVel

- Jul 11, 2025
- 3 min read
Updated: Feb 26
Imagine spending hours perfecting your Power BI reports, only to struggle when trying to present them clearly to your stakeholders or audience. Power BI is excellent for interactive dashboards, but sometimes, a good old PowerPoint presentation is what you really need. The good news? Combining these two powerful tools can take your data storytelling to the next level.
In this post, you'll discover simple yet powerful ways to seamlessly integrate Power BI reports into your PowerPoint presentations, keeping your audience engaged from start to finish.

Why Combine Power BI and PowerPoint?
Power BI excels at data exploration, interactivity, and detailed analysis, but sometimes you need to simplify or summarize your data for a broader audience. PowerPoint shines here because it’s universally accessible and easy to follow during meetings or presentations.
By bringing these tools together, you combine deep analytical capabilities with effective storytelling.
Embedding Power BI Reports Directly into PowerPoint
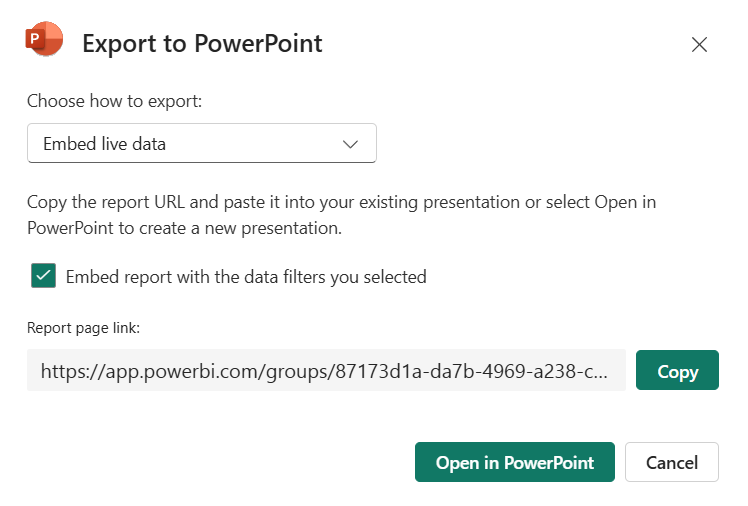
Power BI recently introduced a fantastic integration directly within PowerPoint. Here’s how:
Open your Power BI report online.
Click on "Export" and select "Embed live data in PowerPoint."
Open the downloaded PowerPoint file.
Log into your Power BI account if prompted.
Now, your live interactive Power BI report is directly embedded in your slides! This way, your audience can interact with the live data right from the presentation itself.

Using Static Screenshots for Simpler Presentations
Sometimes, embedding live data might not be necessary—or possible. For instance, your presentation might require stable snapshots of data from a specific time. Here’s how you can easily add static Power BI visuals:
Navigate to the visual you want to include in your PowerPoint.
Use Power BI's built-in screenshot tool ("Export" → "Export as image") or your preferred screenshot software.
Paste the screenshot directly into your PowerPoint slide.
Make sure your visuals are clear, high-quality, and relevant to your narrative.
Leveraging Power BI Export to PowerPoint Feature
Another handy built-in feature is the "Export to PowerPoint" option. Here’s the quick rundown:
In your Power BI service, click "Export" → "PowerPoint."
Choose your export options and click "Export."
This feature creates a PowerPoint deck with each page of your report as a separate slide, allowing a quick way to move your visuals into PowerPoint.

Best Practices for Integrating Power BI and PowerPoint
Keep it clear and simple: Power BI offers advanced analytics, but ensure your PowerPoint slides remain simple and understandable.
Focus on storytelling: Structure your slides to tell a clear story with your data.
Maintain branding consistency: Align the design of your Power BI visuals with your overall PowerPoint theme.
Test before presenting: Ensure all embedded reports and visuals work flawlessly beforehand.
Common Issues and Quick Fixes
Even great tools occasionally have hiccups. Here are quick solutions:
Issue: Embedded reports aren’t interactive.
Fix: Ensure you're logged in to the correct Power BI account, your report permissions are set correctly, and that you have a valid Power BI license (like Pro or Premium).
Issue: Exported visuals are blurry.
Fix: Use the "Export as image" option directly in Power BI for sharper visuals.
Issue: Unable to access embedded reports.
Fix: Check if the user has the appropriate Power BI license and report access permissions.
Most organisations have policies and security measures related to the installation of apps within specific tenants and accounts. Usually, this must be done through the IT department. If you have these permissions, then you can add Power BI (app) in Developer > Add-ins in PowerPoint. Note: Developer mode is usually deactivated, and you need to activate it through Options > Customize ribbon.

Final Thoughts
Integrating Power BI and PowerPoint helps bridge the gap between complex analytics and impactful storytelling, ensuring your audience doesn’t just see data but understands and engages with it.
Try these simple integration techniques in your next presentation and watch as your data insights truly resonate!


Comments