
PROJECT CASE STUDY
Fleet Performance Dashboard
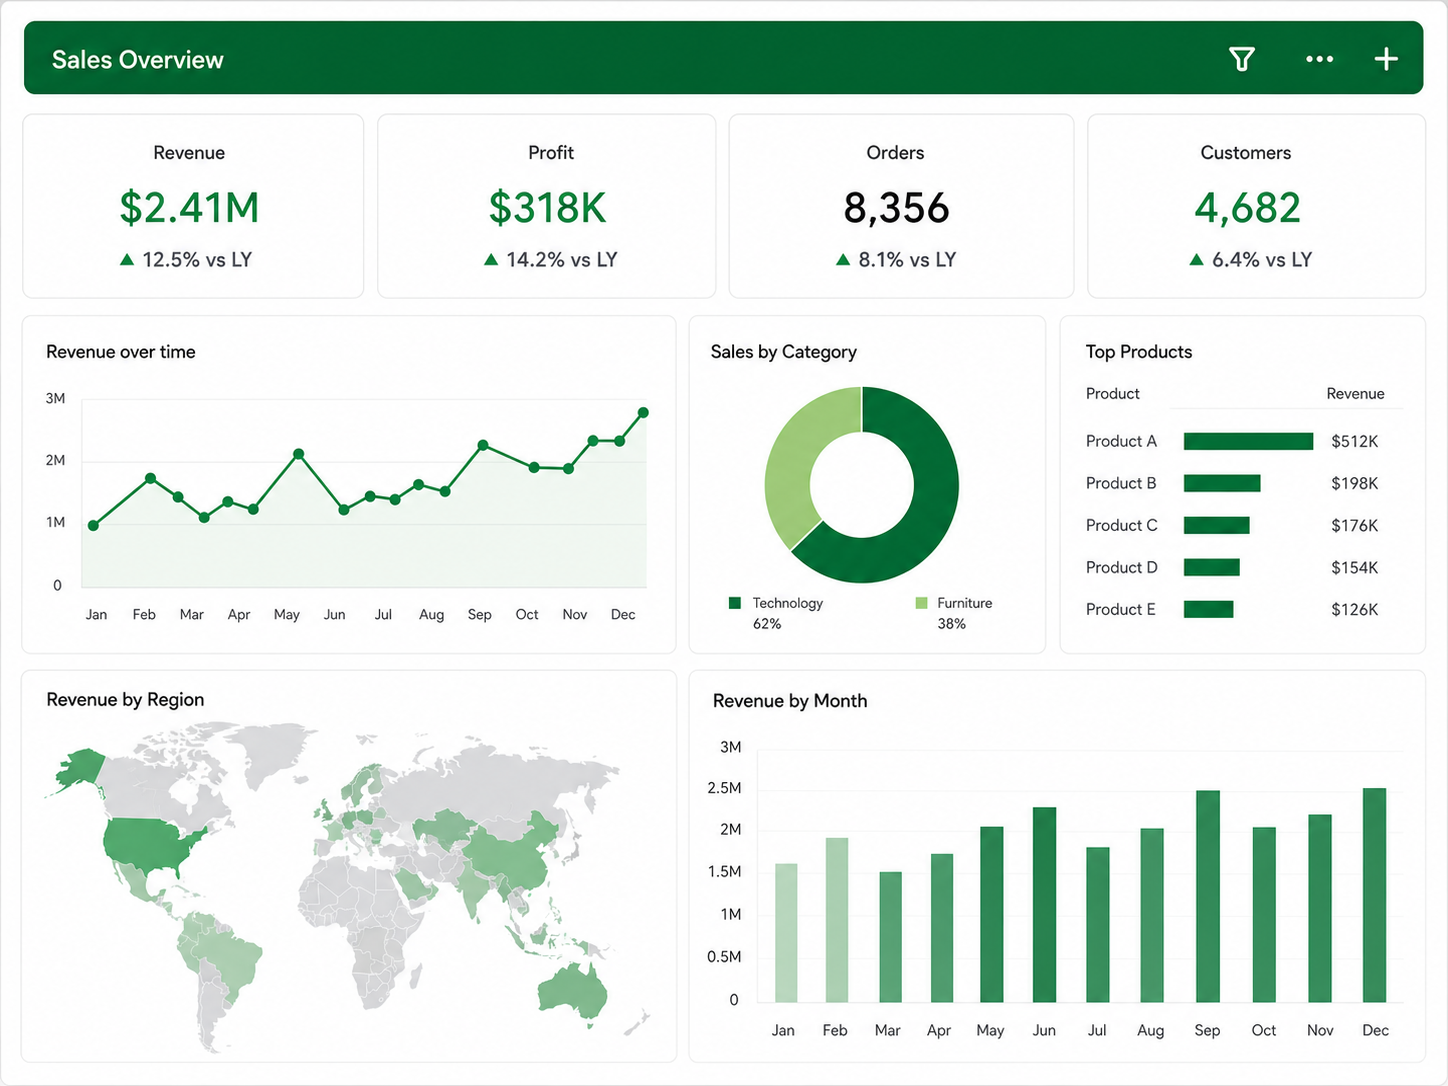
A single Excel dashboard for monitoring fuel, maintenance, utilization, overdue services, and regional revenue across 50 vehicles.
The challenge
The operations team was combining 12 vehicle data sources manually and needed a reliable weekly overview.
The solution
The data was standardized into a refreshable model and presented through focused operational and financial KPIs.
The outcome
Fleet review time fell to under five minutes and the team saves an estimated three to four hours every week.