
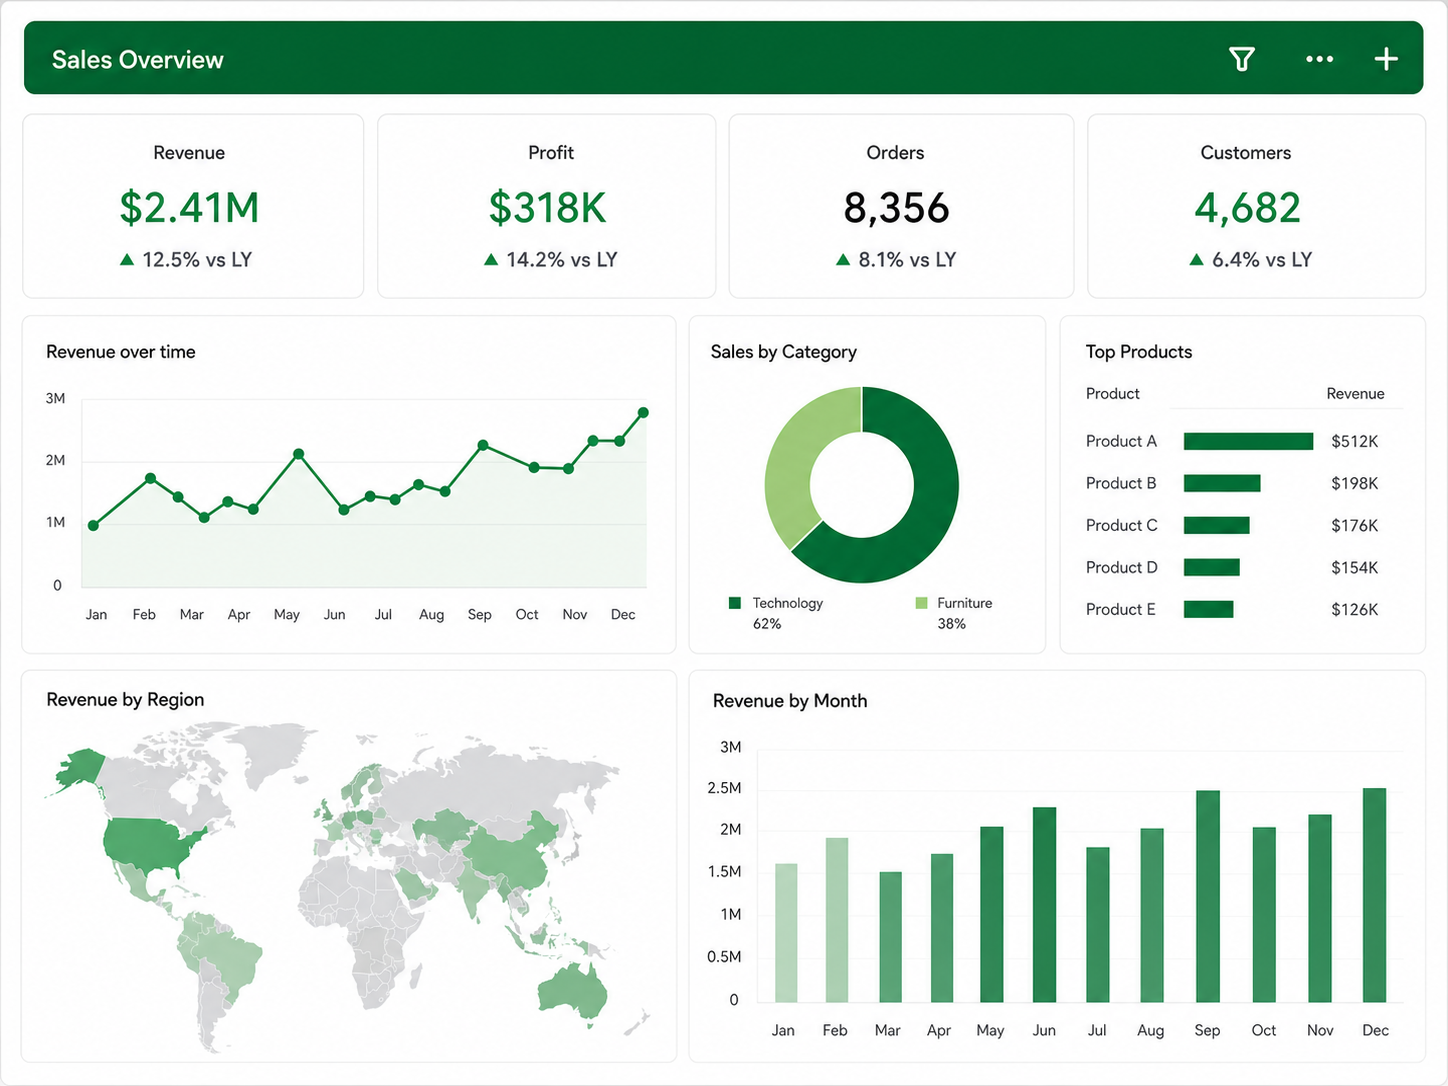
Fleet Performance Dashboard
A single Excel dashboard for monitoring fuel, maintenance, utilization, overdue services, and regional revenue across 50 vehicles.
Read case studyExplore practical Excel and Power BI work—from business reporting and quality systems to finance, HR, risk, and live-data analytics.
A single Excel dashboard for monitoring fuel, maintenance, utilization, overdue services, and regional revenue across 50 vehicles.
Read case study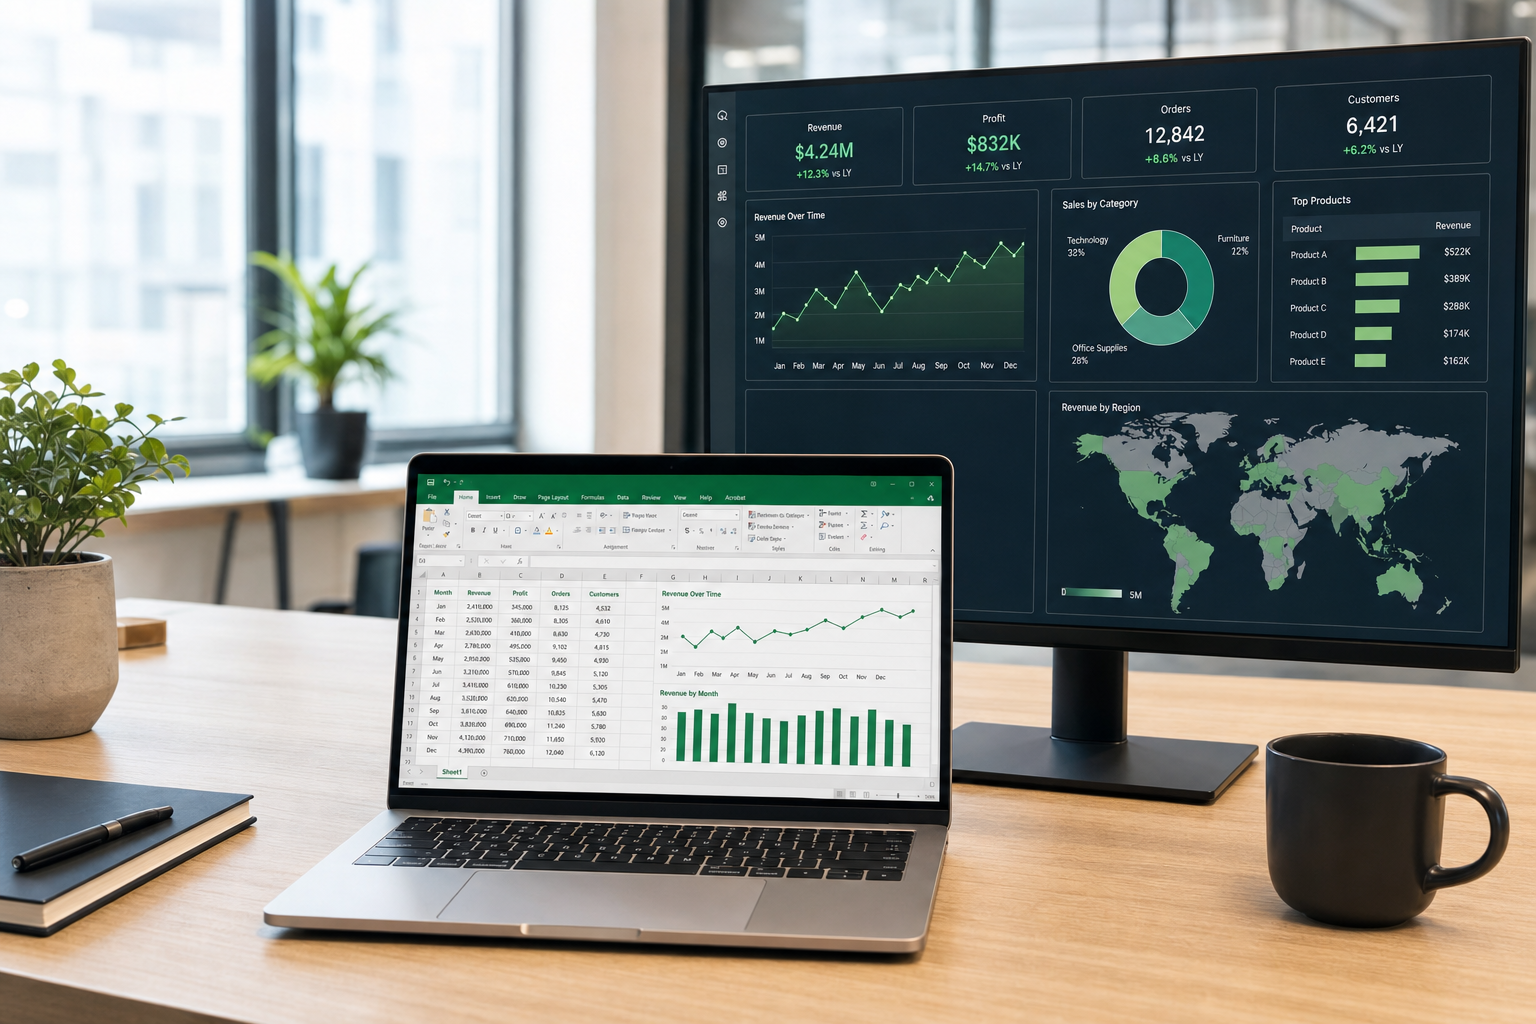
A multi-sheet Excel model that connects assets, debts, income, fixed costs, and variable expenses to one decision-ready dashboard.
Read case study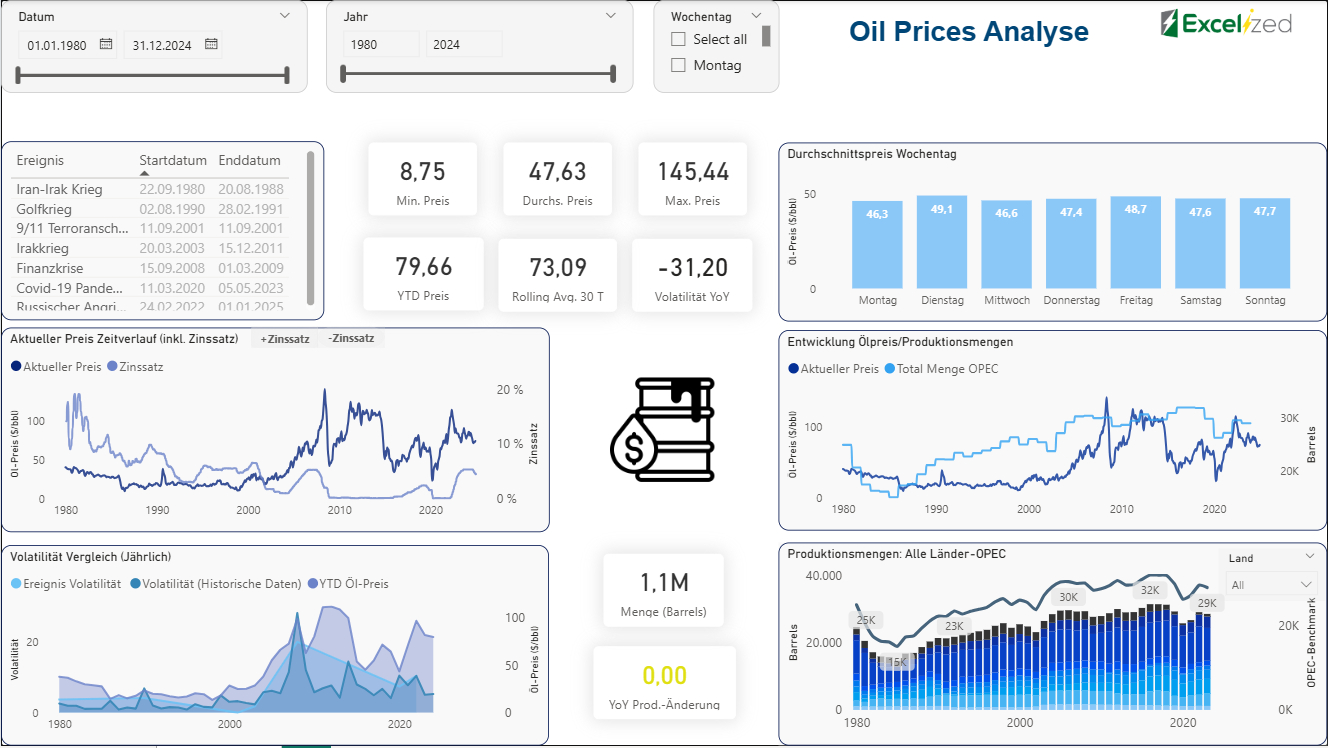
An interactive Power BI report for tracking oil-price development, market events, interest rates, volatility, and OPEC production.
Read case study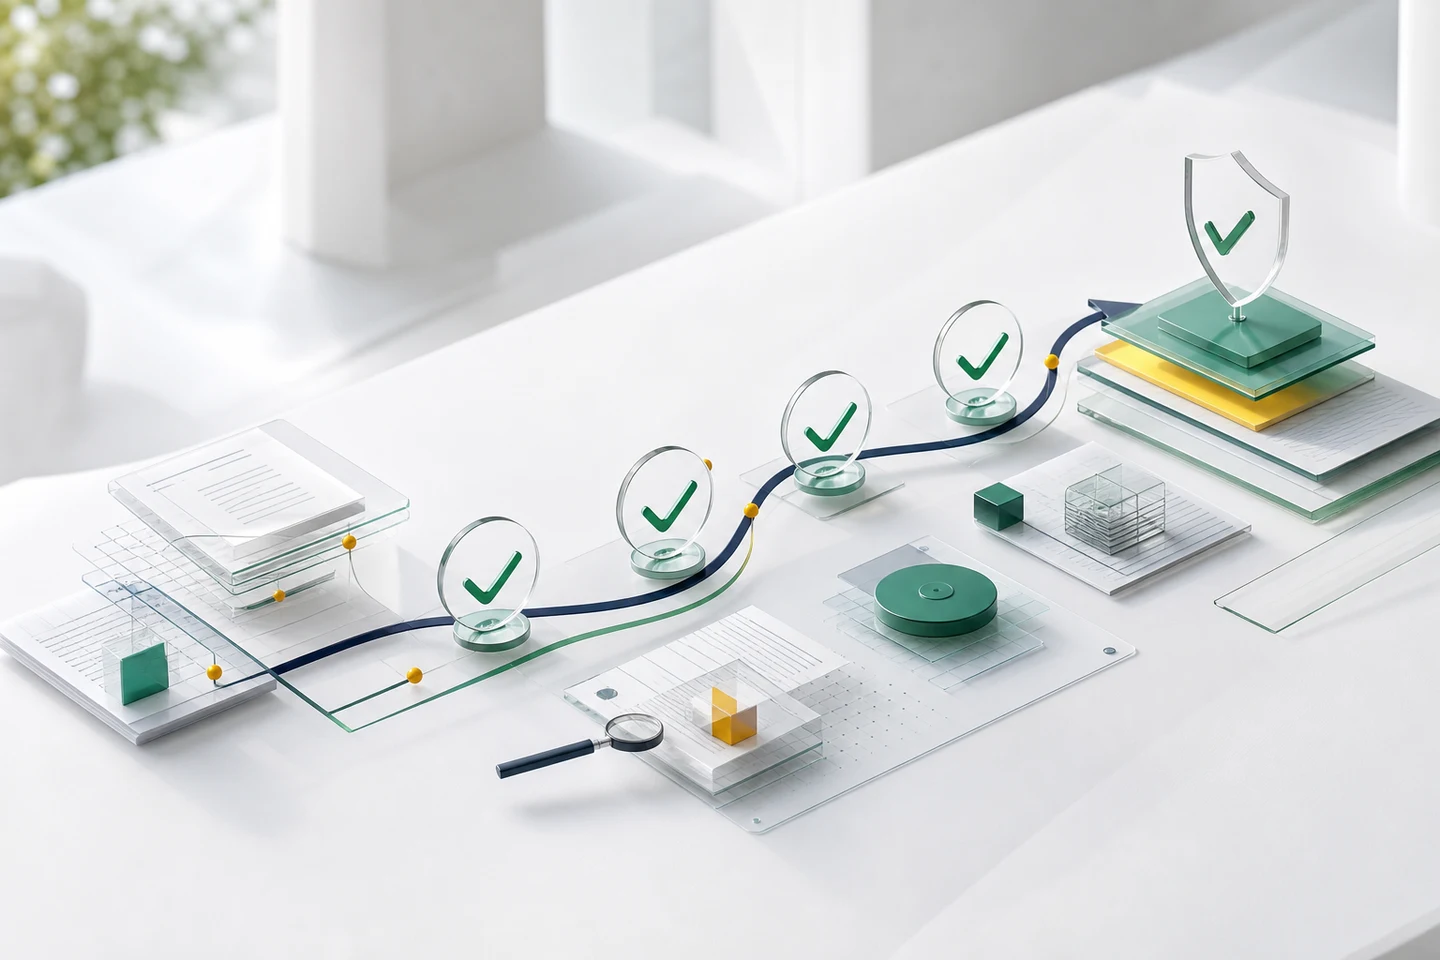
A unified Power BI solution for monitoring deviations, CAPAs, and change controls from QEdge exports.
Read case study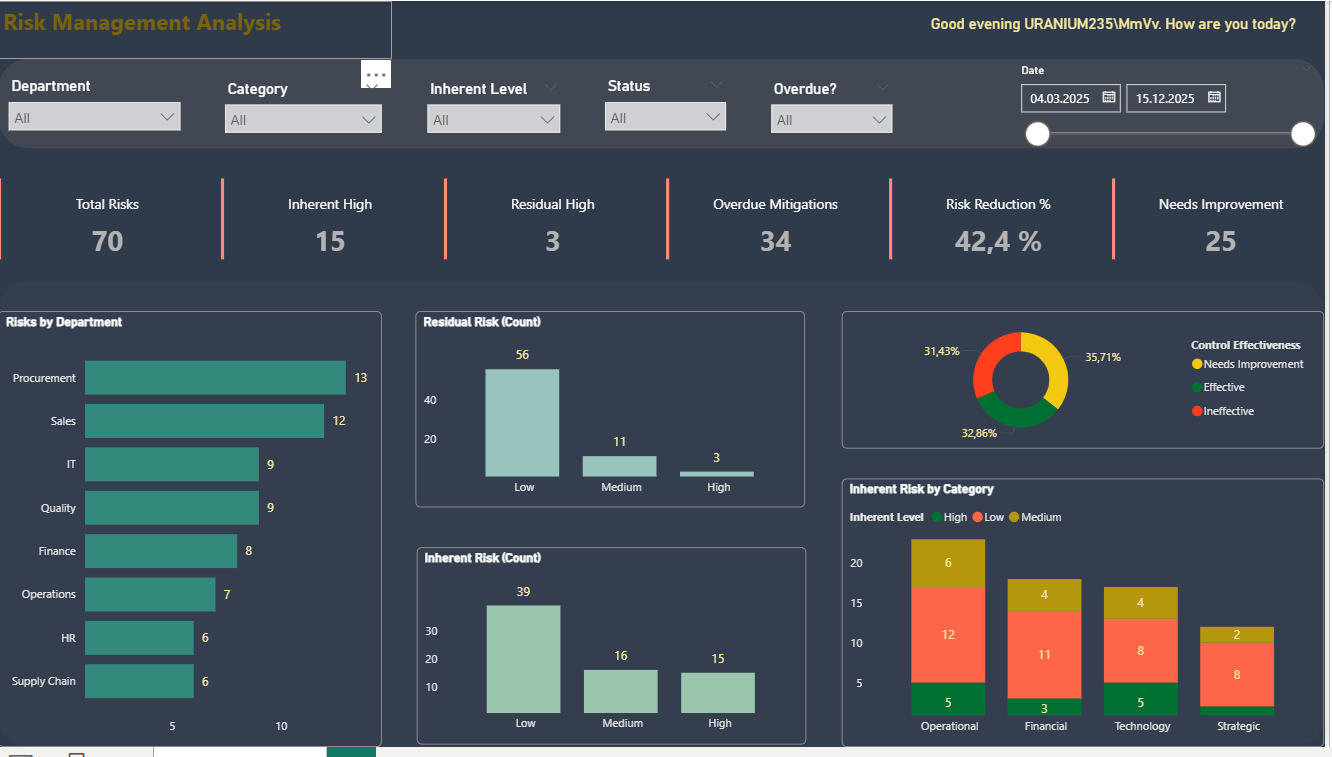
An interactive Power BI dashboard for monitoring departmental risks, controls, mitigation plans, and target values.
Read case study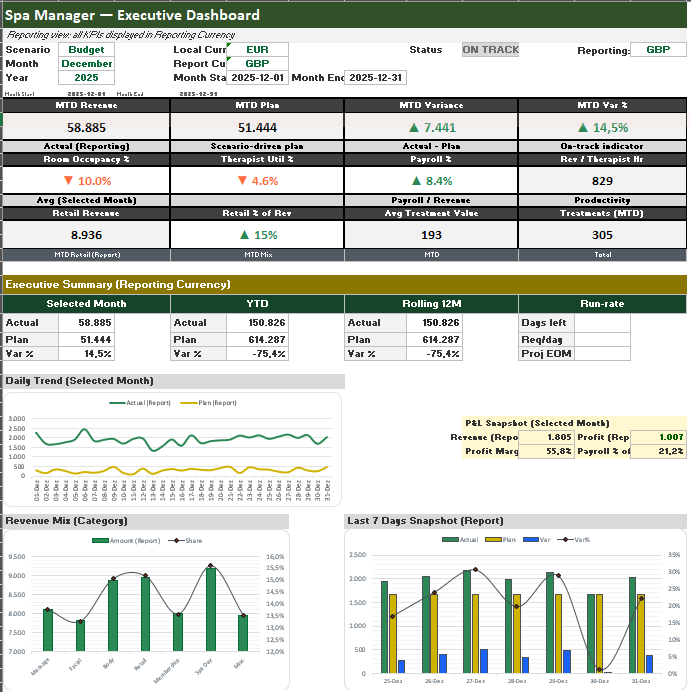
A compact executive report for monitoring spa revenue, payroll, productivity, retail performance, treatments, and profit-and-loss indicators.
Read case study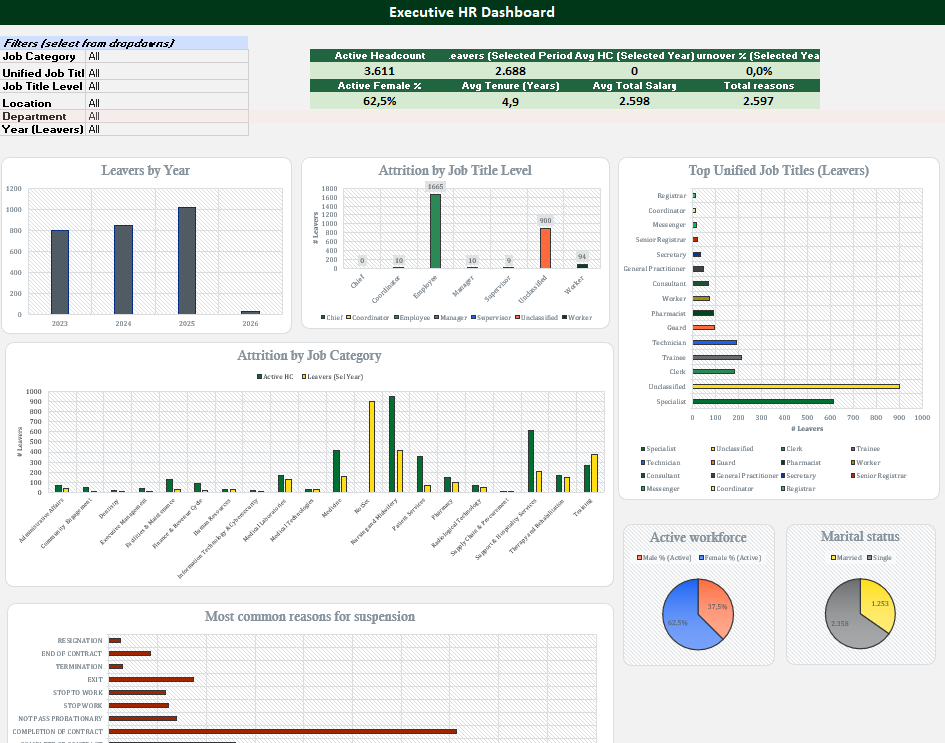
An interactive workforce dashboard covering headcount, leavers, attrition, tenure, salary, composition, and turnover trends.
Read case study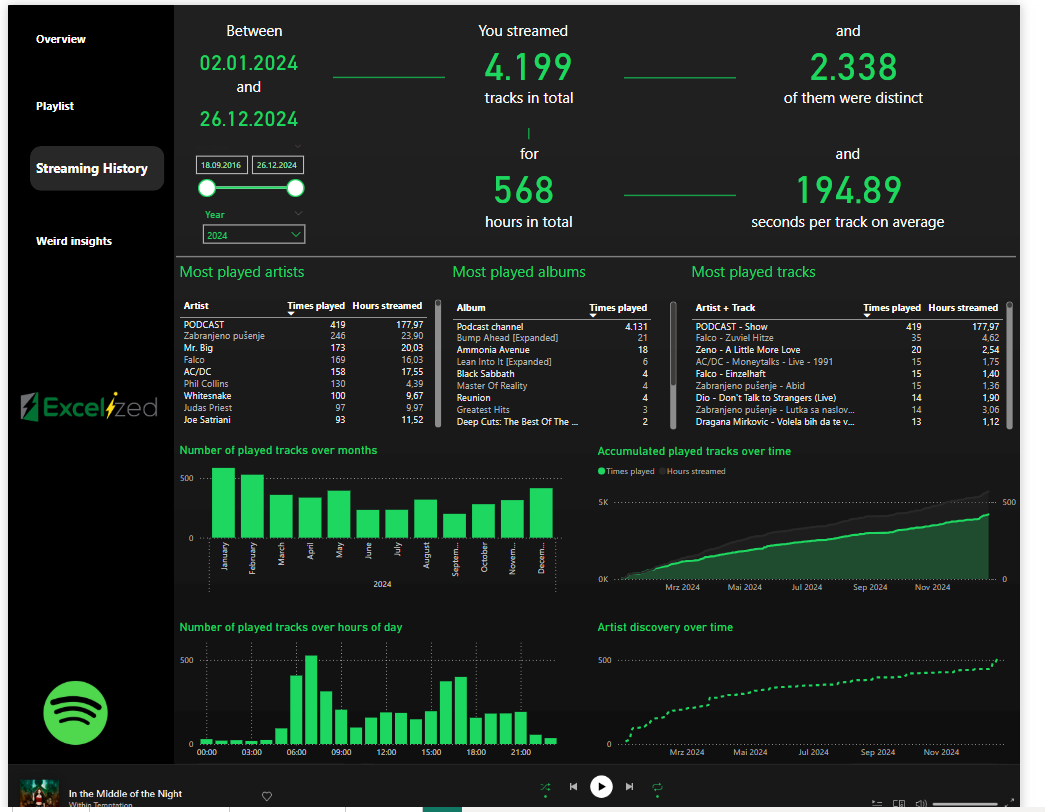
A modern Power BI report that turns personal streaming history into artist, album, track, and listening-pattern insights.
Read case study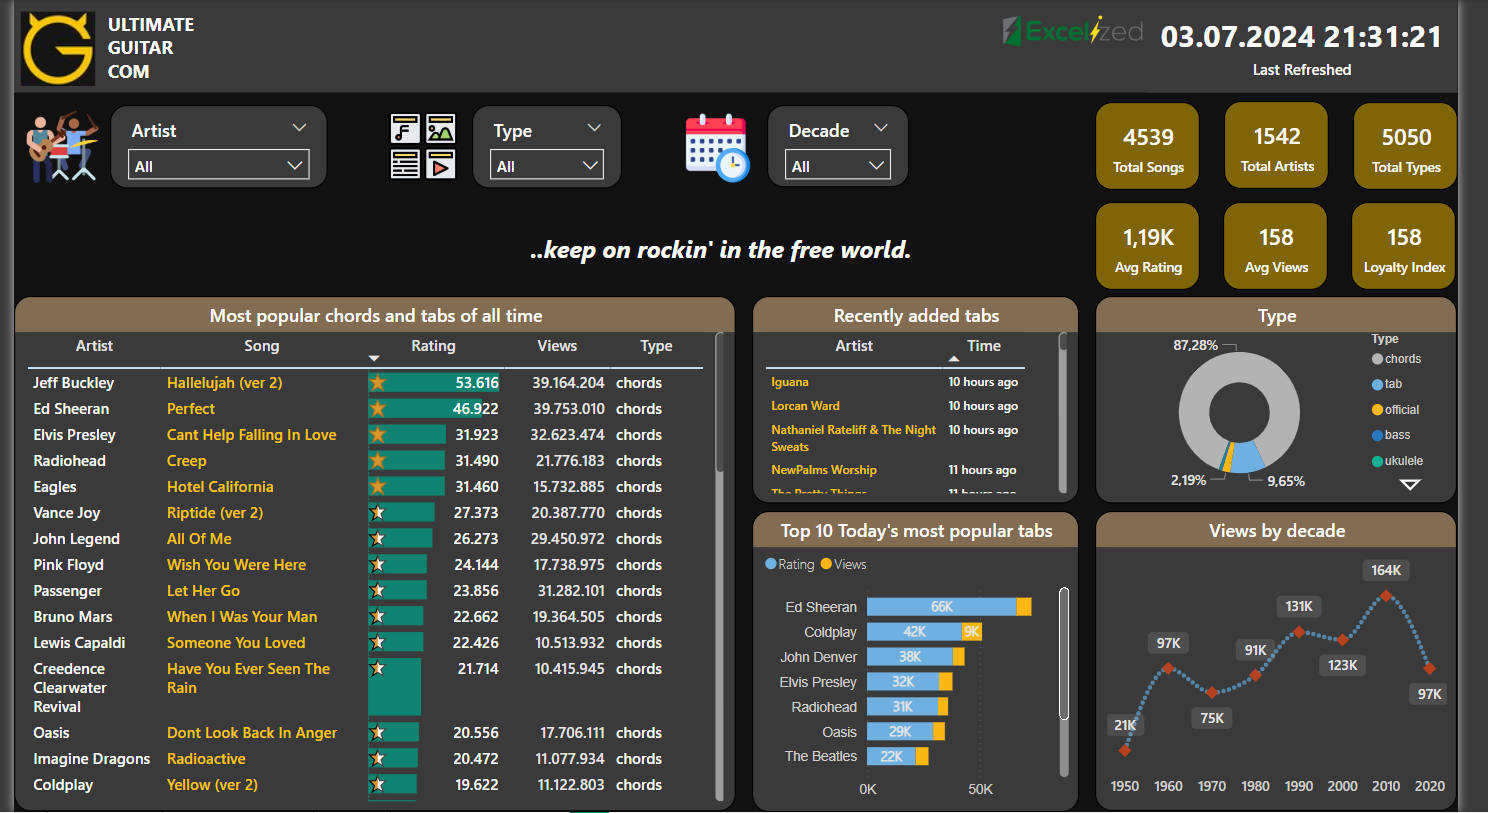
An interactive content dashboard analysing songs, artists, tabs, chords, ratings, views, and trends across decades.
Read case study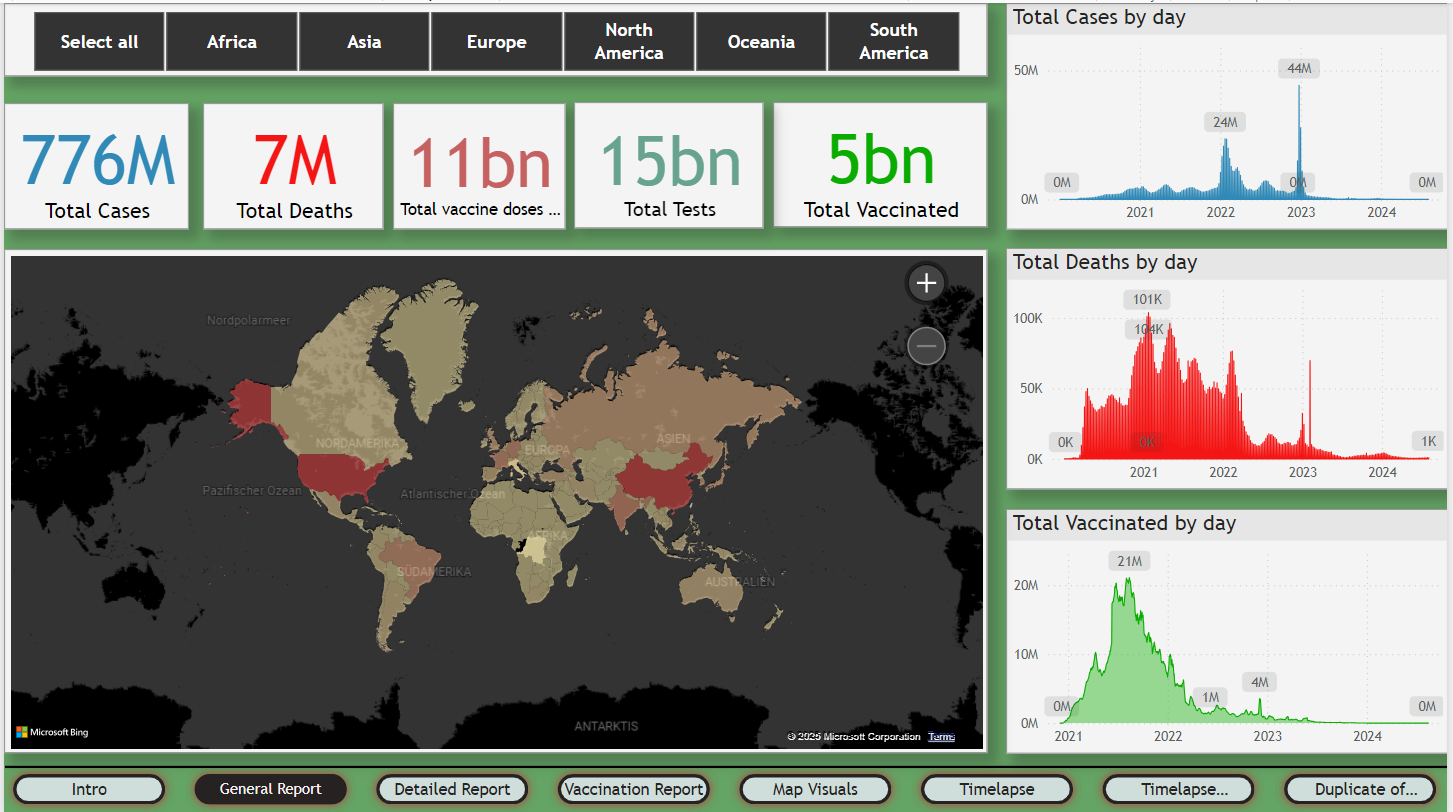
A global Power BI dashboard for exploring cases, deaths, testing, vaccinations, and geographic spread.
Read case study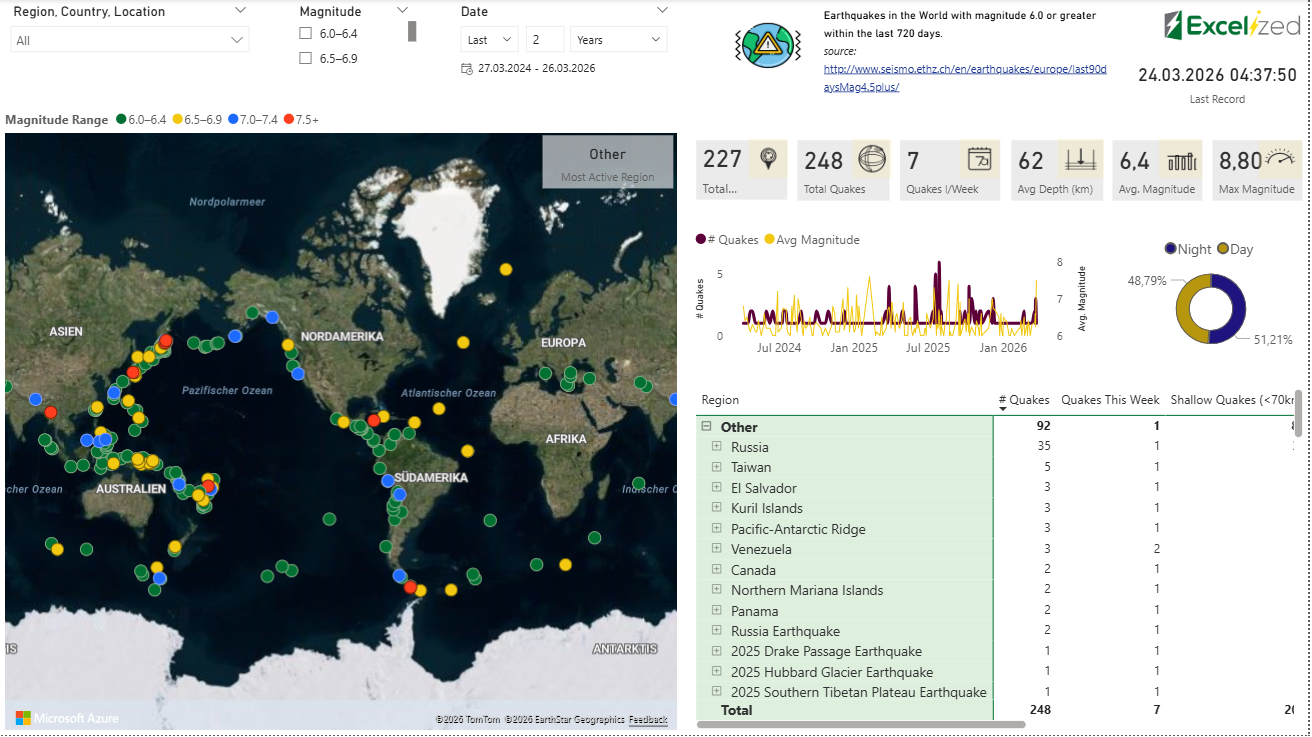
A live Power BI dashboard for monitoring recent earthquakes by location, magnitude, depth, frequency, and region.
Read case study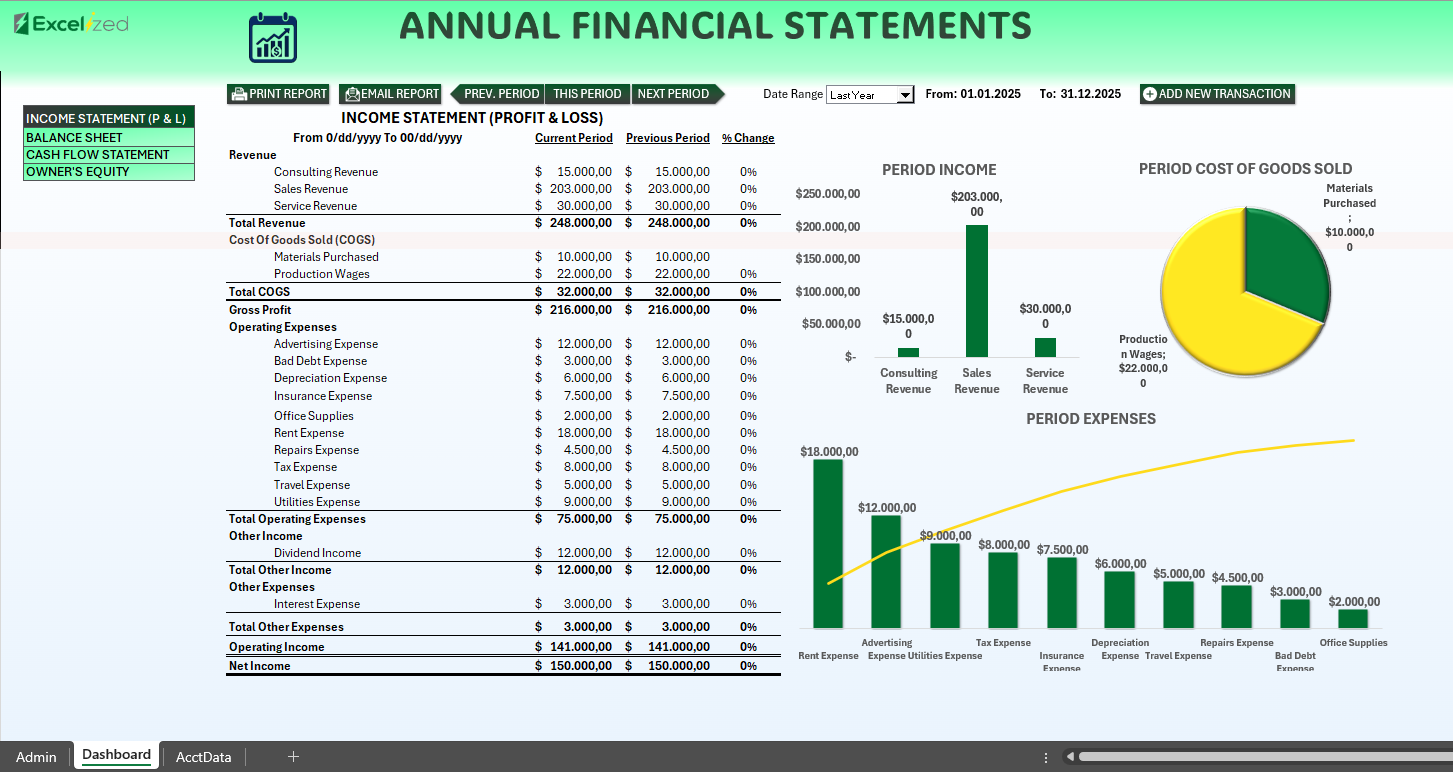
A macro-enabled Excel reporting tool combining profit and loss, balance sheet, cash flow, and owner’s equity.
Read case study
A consolidated Excel dashboard bringing financial, operational, and forecasting indicators into one executive view.
Read case study