
PROJECT CASE STUDY
Latest Earthquakes Dashboard
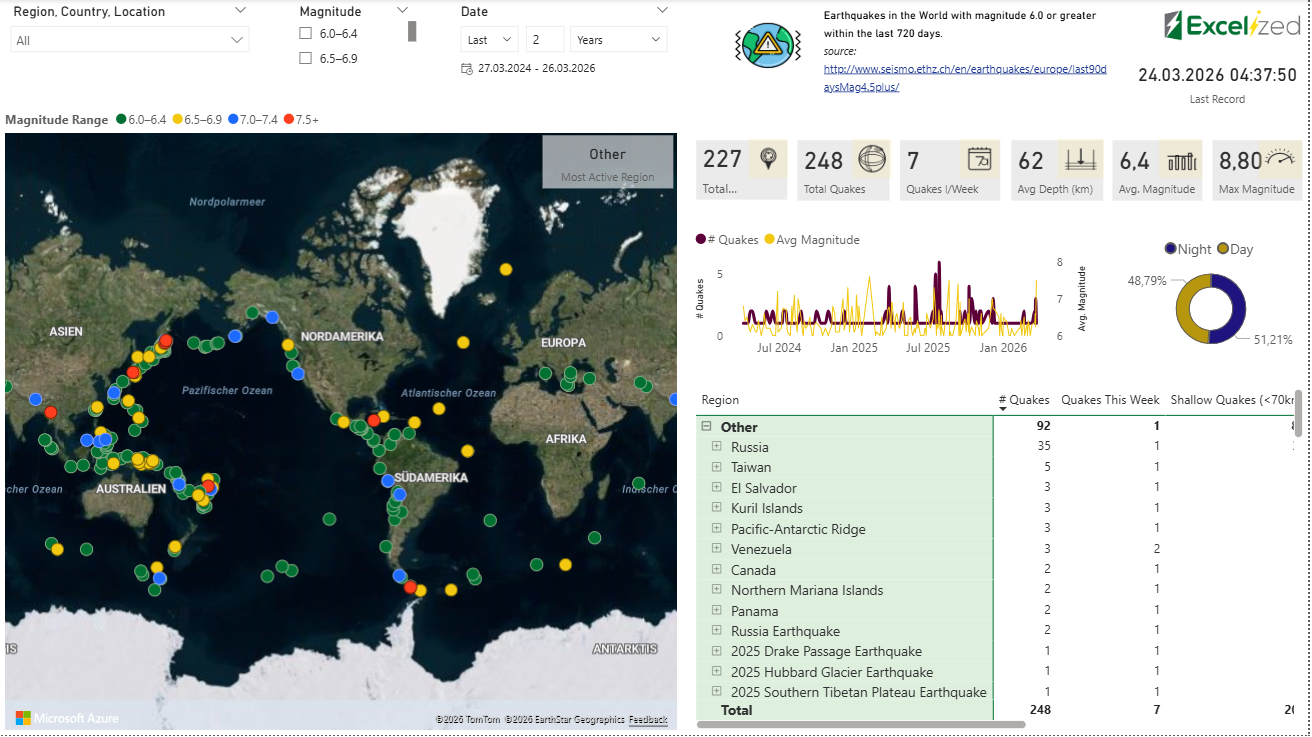
A live Power BI dashboard for monitoring recent earthquakes by location, magnitude, depth, frequency, and region.
The challenge
Live earthquake data from ETH Zurich needed to be transformed into a clear view of weekly activity, severity, depth, and geographic concentration.
The solution
A dynamic report was created with country and regional filters, magnitude and date ranges, headline KPIs, activity trends, and map-based exploration.
The outcome
The dashboard provides a current overview of the most active regions and recent earthquake patterns. It was delivered in 10 days.