
PROJECT CASE STUDY
Global COVID-19 Dashboard
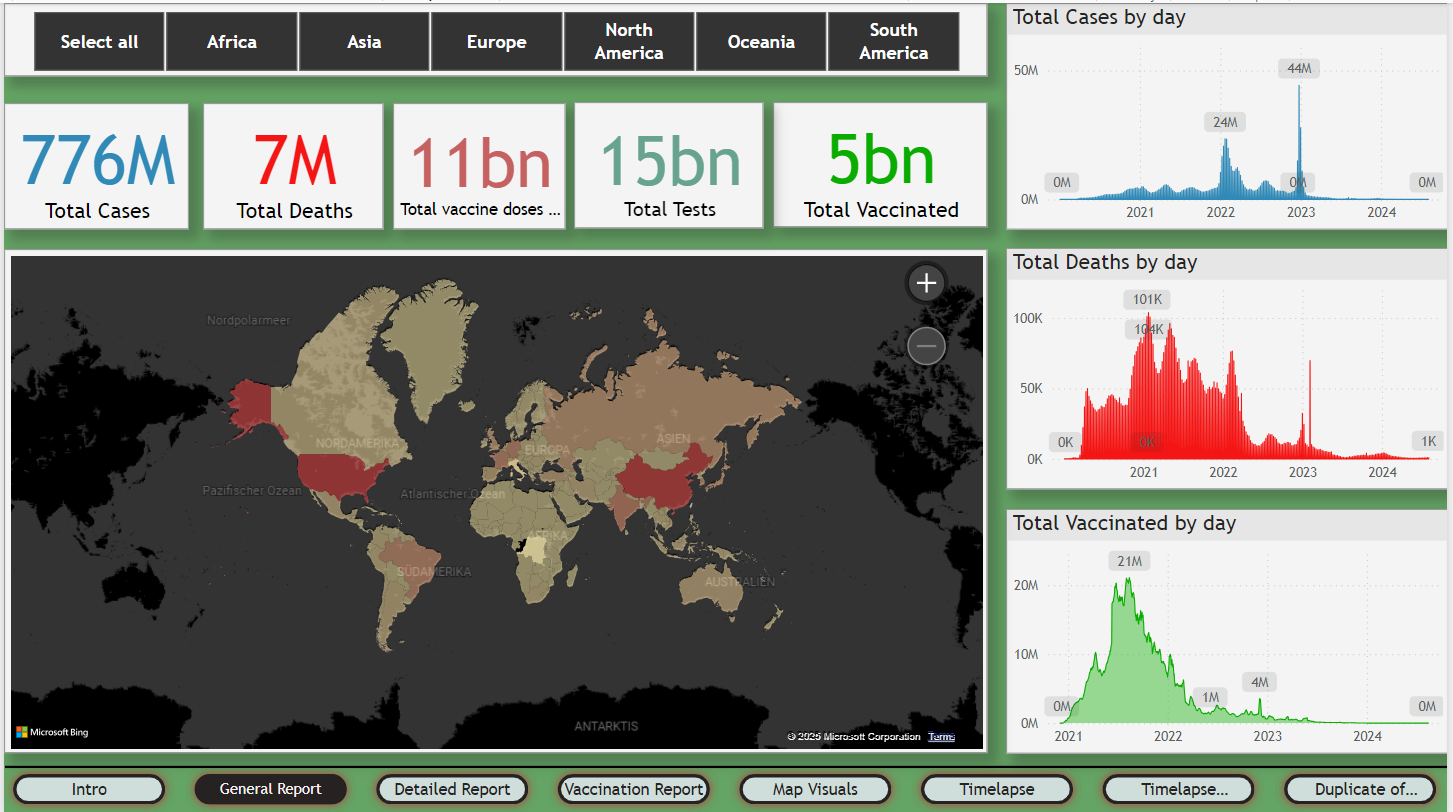
A global Power BI dashboard for exploring cases, deaths, testing, vaccinations, and geographic spread.
The challenge
Global pandemic data required both a fast executive overview and a way to compare daily developments across continents and countries.
The solution
An interactive report was built with regional filters, KPI summaries, daily trends, vaccination and testing measures, and map-based comparisons.
The outcome
The dashboard provides a consistent global and regional analysis experience and was delivered in 15 days.