

The New Power Query Editor in Power BI Desktop: A Practical Guide

Introduction
The Power Query Editor is where a reliable Power BI model begins: you connect to sources, clean columns, combine tables and decide what should load. In September 2026, Microsoft brought a modernized Power Query Editor experience into Power BI Desktop as a preview. It adds a refreshed editing surface and brings several capabilities into Desktop, including Schema view, Query Script view, Rank column and Cluster values. This guide shows how to try it, where it can help, and what to check before using it in an important production workflow.
Why this matters
Many Power BI users learned Power Query in Excel, Power BI Desktop or a browser-based dataflow editor. Similar transformation concepts appear in each, but the available interface and features have not always matched. The new Desktop experience narrows some of that gap while keeping Power Query inside the tool analysts already use to build semantic models.
The practical benefit is not simply a redesigned ribbon. A schema-focused view can make wide tables easier to work with; a visual diagram can help explain how queries depend on one another; and query folding information can help you investigate whether transformations are being pushed back to a source. These features support better decisions, but they do not automatically make a query faster or a model correct.
Because the editor is still a preview and Microsoft documents known gaps, the right approach is to try it on a copy of a representative PBIX file, compare the workflow with the legacy editor, and switch back when a required command or connector option is missing.
What is new in the Power Query Editor?
The modern editor preview brings an updated Get Data and editing experience to Power BI Desktop. Microsoft’s September 2026 feature summary highlights new Desktop capabilities such as Rank column, Cluster values, Schema view and Query Script view, alongside improvements to query diagnostics and navigation. The new editor uses the Power Query engine; the change is primarily the experience and the set of commands exposed in Desktop.
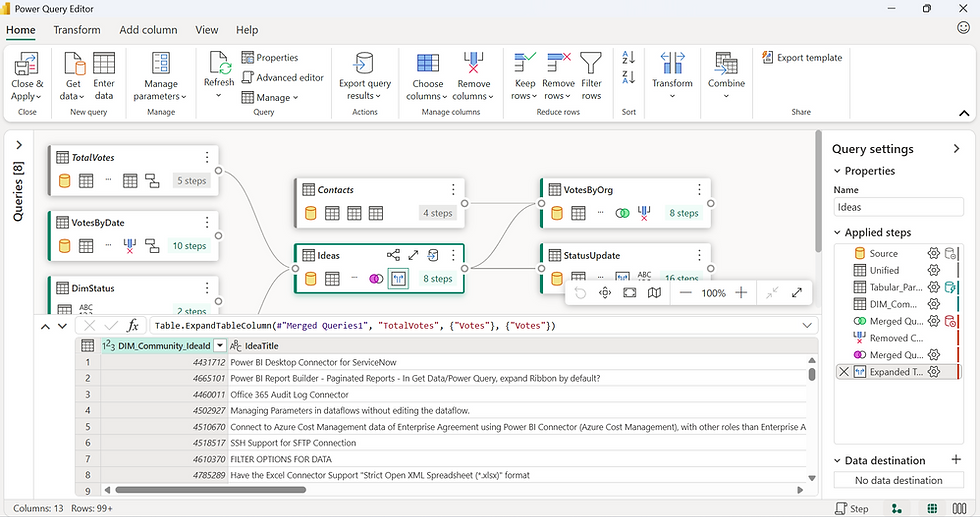
Schema view puts column-level information and transformations in focus. It is useful when you are managing a wide table and need to rename, reorder or inspect columns without repeatedly scrolling through all rows. Query Script view provides an in-editor way to work with M expressions while keeping the rest of the editor available. Diagram view helps you inspect query relationships visually, and query plan and folding indicators provide clues about evaluation.
Rank column and Cluster values are useful for specific shaping tasks. Ranking can add an ordinal position based on selected values and sort logic. Clustering helps group similar text values when source labels are inconsistent. These commands can speed up routine preparation, but the rules and resulting groups still need human review.
Step-by-step: try the new experience safely
Step 1: Use a copy of a real report
Choose a PBIX file with a few representative queries: a source query, a cleaned table, and perhaps one merge or reference. Save a separate test copy before enabling the preview. This gives you a realistic place to check the workflow without risking the production file. Start with a file whose transformations you understand, so you can compare the preview with a known baseline.
Step 2: Enable the preview
In Power BI Desktop, select File > Options and settings > Options. Under Preview features, select New Power Query experience, then choose OK. This same preview setting enables both the new Get Data experience and the new Power Query Editor. Microsoft’s current guidance says you do not need to restart Desktop. If your interface does not show the option, check that Desktop is up to date and consult the current documentation for your installed version.
Step 3: Open the editor and orient yourself
On the Home ribbon, choose Transform data. Confirm that your query list, preview, formula bar and Applied Steps are available. Open a query you know well, then locate the data, schema and diagram views. Treat the first pass as orientation: verify that the preview and applied steps correspond to the transformations you expect.
For a wide table, switch to Schema view and inspect column names and types. Use it for structural work such as reordering or applying supported column-level transformations. Return to the data preview when you need to validate actual values, nulls, duplicates or examples. A schema view can help with column management, but it does not replace checking the underlying records.

Step 4: Trace dependencies with Diagram view
Open Diagram view on a query set that uses references, merges or appended tables. Follow the arrows from source queries through intermediate transformations to the final loaded table. This can make it easier to find duplicated work or understand an inherited model, but the diagram is a navigation aid rather than proof that the logic is correct.

Pick one final table and trace it back to the source. Check whether staging queries are load-disabled where appropriate, and confirm that joins use the intended keys and join kind. Then inspect the actual Applied Steps and preview before changing anything. A visual layout may make a dependency easier to understand while still leaving business rules to be verified.
Step 5: Investigate folding and query plans
For a query against a source that supports folding, inspect the folding indicators and query plan if available. Look for the step where folding changes or stops, then consider whether a later transformation can be moved earlier, simplified, or handled by the source. Do not assume every transformation can fold, and do not judge performance from the indicator alone.

A folding indicator tells you about the folding status of a step; it does not measure the time users will experience. Source indexes, network latency, data volume, gateway capacity and model refresh settings also matter. When performance matters, test refresh duration and source load with comparable data and conditions. Treat diagnostics as evidence to investigate, not as a performance score.
Step 6: Add a rank or cluster transformation
Try Rank column on a small table where the business meaning of order is clear, such as ranking products by revenue or customers by order count. Decide how ties should be handled and which columns define the sort. Validate the first, last and tied rows against a hand-checked sample before trusting the result in a report.
Try Cluster values on a text field with known spelling variants, such as product names or locations. Review proposed groups before accepting them. Clustering is a data-cleaning aid; it can merge labels that look similar but refer to different entities, so retain a mapping or correction process for important business dimensions.
Step 7: Use Query Script view for focused M edits
When you need to edit M, use Query Script view for a focused change and keep the code small. Make one change at a time, apply it, then inspect the resulting preview and Applied Steps. If a script produces an error, use the error details and compare the code with the prior working version rather than replacing several steps at once.
Query Script view does not remove the need to understand M. Keep source navigation, data types, null handling and step order explicit. For transformations that affect folding, confirm the effect with the editor’s diagnostics and a refresh test. Keep a copy of the previous working version so rollback is straightforward.
Practical example: standardizing product names

Imagine a sales table with a ProductName column containing “Green Tea 250g”, “Green tea 250 g” and “Green Tea – 250g”. A simple trim and case-normalization may not make these values identical because spacing and punctuation differ. Start by profiling the distinct values and checking whether the variants are truly the same product.
Use Cluster values to propose groups of similar labels, then review each group against a product master or another trusted source. Create or maintain an explicit mapping table for accepted aliases, such as source label to canonical product name. Merge that mapping into the sales query and preserve the original label for auditability.
After the merge, compare row counts and sales totals before and after the transformation. Check unmatched values, duplicate mapping keys and many-to-many join risks. The output should have one canonical product label per known product while leaving unresolved values visible for follow-up. Schema view can help inspect final columns; Diagram view can show where the mapping query joins the sales data.
This workflow uses the new editor to accelerate exploration, then relies on a controlled mapping and validation step for business-critical data. It avoids treating a similarity suggestion as an authoritative product master. The business rule remains explicit and can be reviewed when product naming changes.
Preview limitations and common mistakes
The new Power Query Editor is documented as a preview, and Microsoft maintains a live list of known limitations. Depending on the connector and workflow, the new experience may not expose every legacy command or connection option. Examples currently documented include missing Quick Access Toolbar controls, some unavailable connector settings, and commands that differ for list results or multi-column calculations.
Before switching a production workflow, verify the connectors, credentials, parameters, transformations and troubleshooting commands your team actually uses. Test refresh in Desktop and the Power BI Service where relevant. A successful preview in the editor does not prove that scheduled refresh, gateway credentials or deployment will behave identically.
A common mistake is changing several transformations while learning the new interface. Another is assuming that a feature shown in a monthly update is generally available in every tenant or installation. Confirm current release notes and product documentation, especially when working in managed environments where Desktop versions are controlled.
If a required task is blocked, return to the legacy experience by clearing New Power Query experience under File > Options and settings > Options > Preview features. Microsoft states that a Desktop restart is not required for this change. Keep the preview enabled only when it helps the workflow and your checks pass.
Bonus tips and common mistakes
Pro tip: keep a before-and-after check
Record the source row count, key totals and a few representative values before a transformation. After changing or grouping data, compare the same checks. This catches accidental row loss, duplicate joins and unexpected nulls more reliably than looking at a small preview alone.
Common mistake: confusing query folding with refresh speed
A folding indicator is diagnostic evidence, not a performance guarantee. Measure refreshes with the same source, volume, credentials and capacity before concluding that one version is faster.
Good to know: preview and legacy experiences can differ
The new and legacy editors can expose different commands or connection settings. Keep a copy of important files and review Microsoft’s limitations page before migrating a team workflow.
Final thoughts
The new Power Query Editor gives Power BI Desktop users a modernized preparation experience and brings useful capabilities such as Schema view, Query Script view, Rank column and Cluster values into the Desktop workflow. Its best use today is deliberate experimentation: try it on a copy, learn which views help your work, and validate transformations with business checks.
Because the feature remains a preview, keep your decision reversible. Check the current limitations, test the connectors and refresh paths you depend on, and return to the legacy editor when a required workflow is not supported. A modern interface can make data preparation easier to inspect; sound modeling still depends on clear transformation logic and careful validation.
Official references
Power BI September 2026 Feature Summary: https://community.fabric.microsoft.com/blog/fbc_pbiupdatesblog/power-bi-september-2026-feature-summary/5325831


Comments