Power BI: Relationships in Models – The Ultimate Guide
Introduction Building effective Power BI reports is not just about loading data and creating visuals—it’s about structuring your data model correctly. Relationships are at the heart of that structure. In this post, we’ll explore what relationships in Power BI are, why they matter, how to create and manage them, and some advanced tricks to avoid common pitfalls. Check out some of our FREE templates and materials. PRACTICE MATERIAL BELOW!👇 Understanding Relationships in Power BI Relationships...

Introduction
Building effective Power BI reports is not just about loading data and creating visuals—it’s about structuring your data model correctly. Relationships are at the heart of that structure. In this post, we’ll explore what relationships in Power BI are, why they matter, how to create and manage them, and some advanced tricks to avoid common pitfalls.
Check out some of our FREE templates and materials.
PRACTICE MATERIAL BELOW!👇
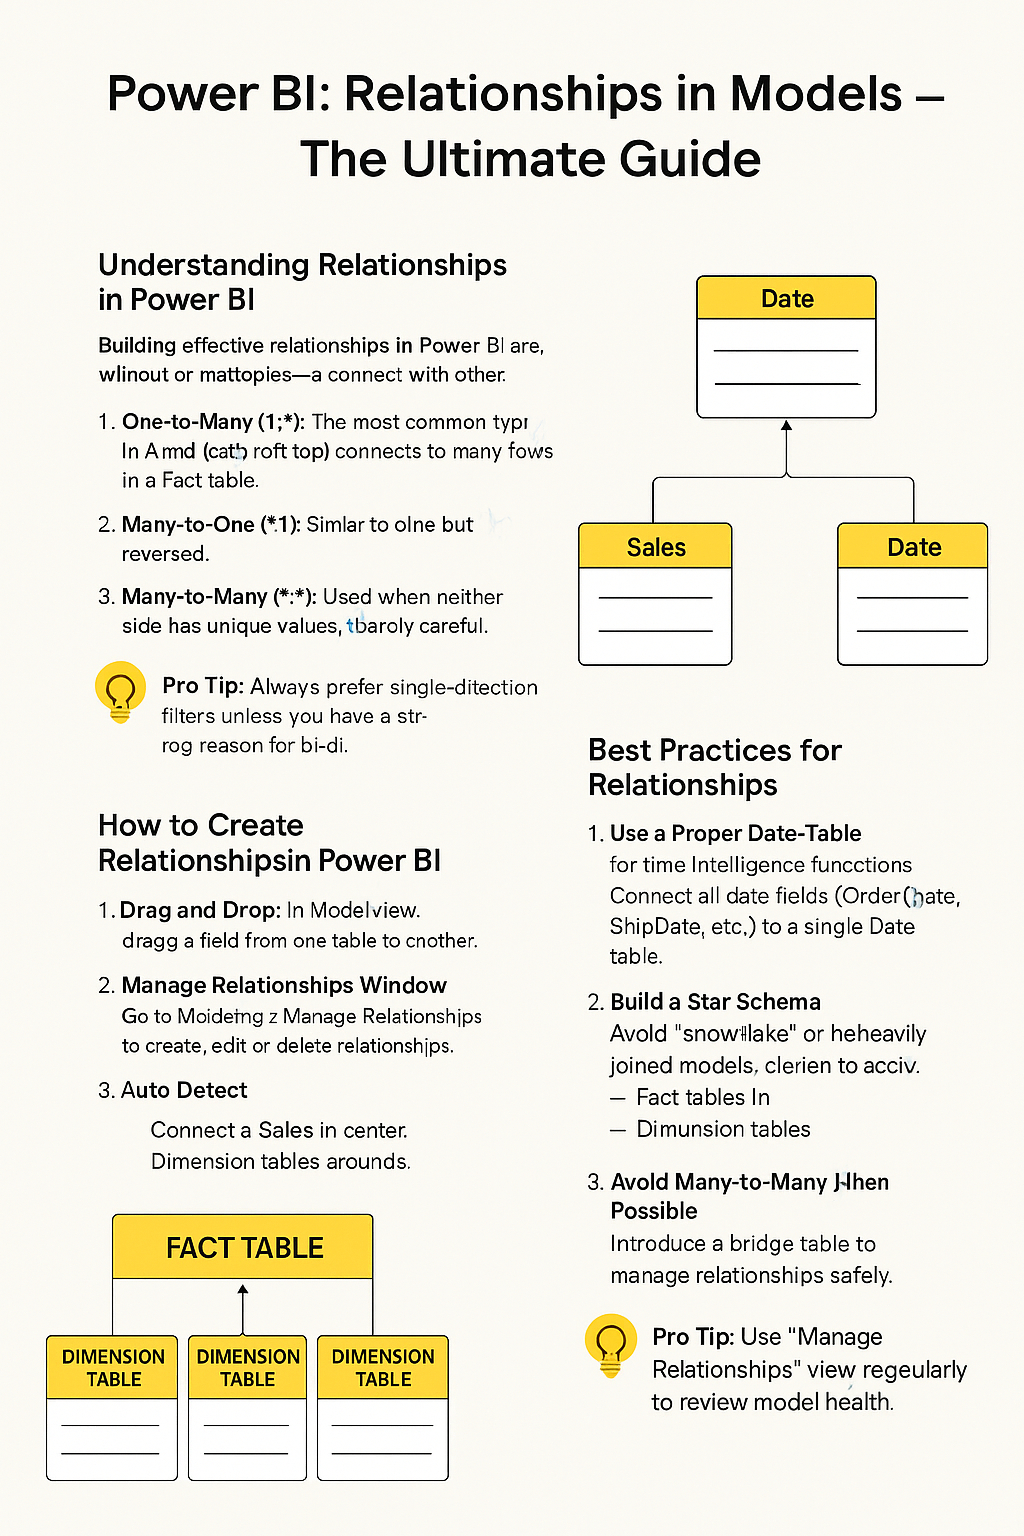
Understanding Relationships in Power BI
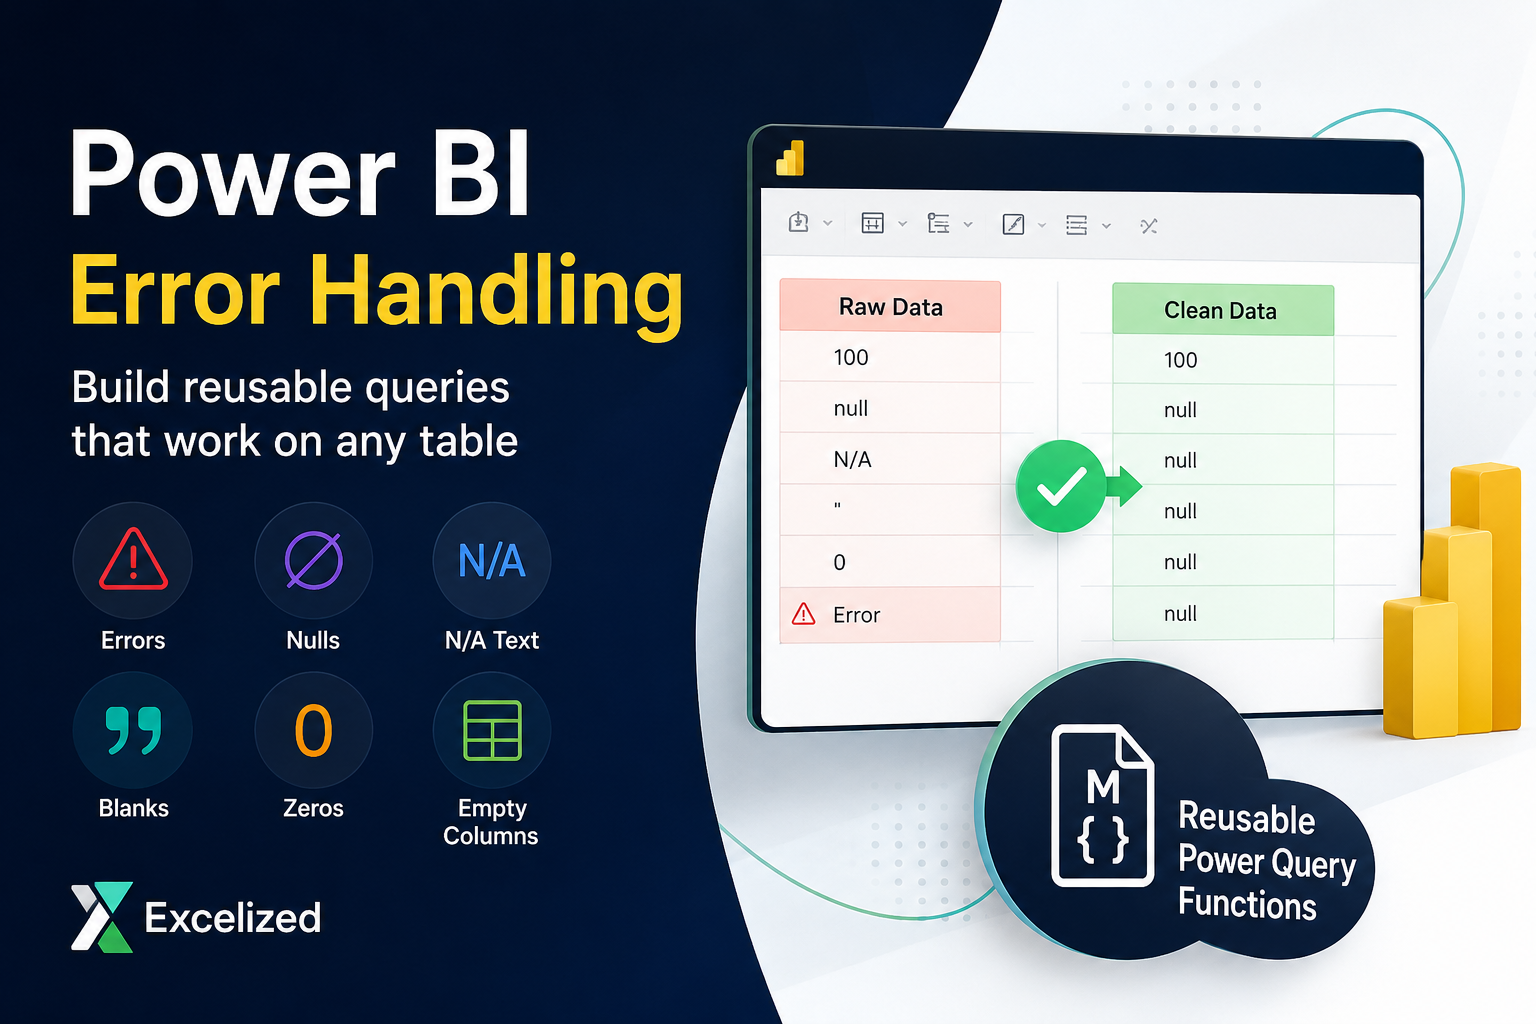
Relationships define how tables connect with each other. Without them, your visuals may show duplicated values, incorrect totals, or completely fail to provide meaningful insights.
Types of Relationships
Power BI supports three relationship types:
One-to-Many (1:*): The most common type. One unique value in a dimension table connects to many rows in a fact table.
Many-to-One (*:1): Similar to above but reversed.
Many-to-Many (:): Used when neither side has unique values. These should be handled carefully to avoid performance issues.
Cardinality and Cross Filter Direction
Cardinality defines how many rows on each side participate.
Cross Filter Direction decides if filters flow one-way (most common) or both ways (useful but can cause ambiguity).
💡 Pro Tip: Always prefer single-direction filters unless you have a strong reason for bi-directional.
How to Create Relationships in Power BI
Drag and Drop: In Model View, drag a field from one table to another.
Manage Relationships Window: Go to Modeling > Manage Relationships to create, edit, or delete relationships.
Auto Detect: Power BI can suggest relationships, but always verify them manually.
Example: Connecting a Sales fact table with a Date dimension using the OrderDate field.
Best Practices for Relationships
1. Use a Proper Date Table
Power BI needs a dedicated date table for time intelligence functions. Connect all date fields (OrderDate, ShipDate, etc.) to this single Date table.
2. Build a Star Schema
Avoid “snowflake” or heavily joined models. Keep your model clean:
Fact tables in the center.
Dimension tables around them.
3. Avoid Many-to-Many When Possible
Instead of using a direct many-to-many, introduce a bridge table to manage relationships safely.
4. Hide Technical Columns
Hide ID fields or helper keys in reports—they should only be used for relationships, not for visuals.
Common Pitfalls and Fixes
Ambiguous Relationships: Happens when multiple paths exist between two tables. Fix by removing redundant relationships or setting filter direction carefully.
Inactive Relationships: You can have multiple relationships between tables, but only one is active. Use USERELATIONSHIP() in DAX when you need the inactive one.
Circular Relationships: Avoid creating loops between tables—it breaks the model logic.
💡 Pro Tip: Use “Manage Relationships” view regularly to review model health.
Advanced Techniques
Role-Playing Dimensions
A Date table can serve multiple roles (e.g., Order Date, Ship Date, Invoice Date). Create multiple relationships—only one active at a time—and use DAX to switch.
Example DAX for inactive relationship:
Composite Models
Combine DirectQuery and Import mode, but carefully manage relationships to keep performance high.
RLS (Row-Level Security) with Relationships
RLS filters flow through relationships. Always test if your relationship setup enforces correct user access.
Step-by-Step Example
Imagine you have these tables:
Sales (Fact) → OrderID, ProductID, Date, Amount
Products (Dimension) → ProductID, Category, Price
Date (Dimension) → Date, Year, Month
Steps:
Connect Sales[ProductID] → Products[ProductID].
Connect Sales[Date] → Date[Date].
Use a star schema for clean analysis.
Test visuals: Sales by Category over Time → should now work perfectly.
Conclusion
Relationships are the backbone of your Power BI model. By mastering one-to-many connections, understanding filter directions, and applying best practices like star schema design, you’ll ensure your reports are accurate, scalable, and fast.
👉 Take time to regularly check your model view, simplify where possible, and always test your DAX measures with real scenarios.
Do you need a starter DAX package in every Power BI project? Just with a slight adjustment to the quick and efficient calculations. Check it out.