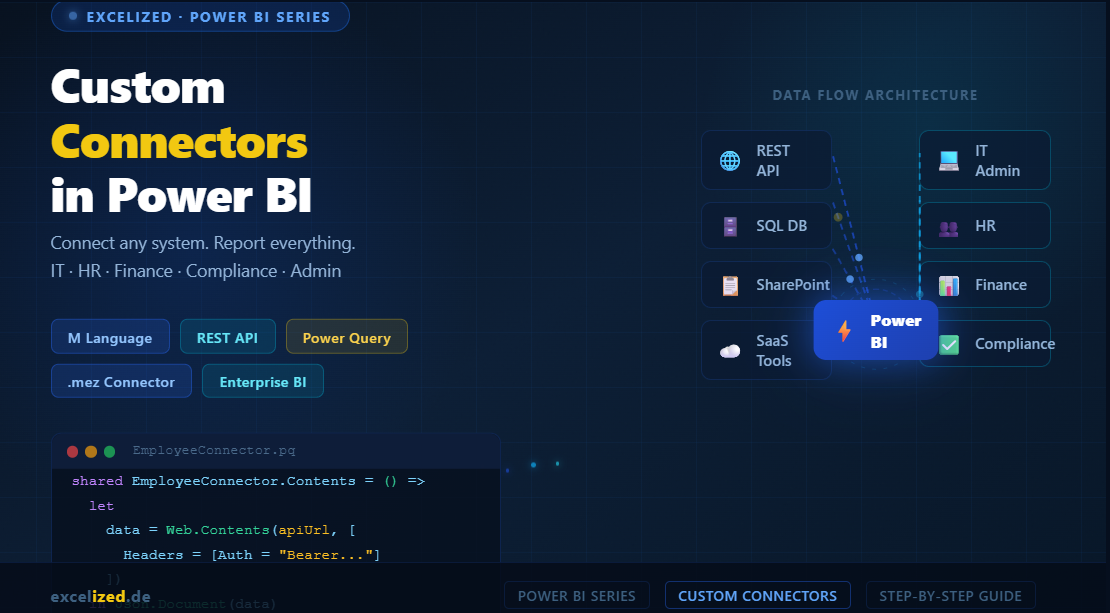
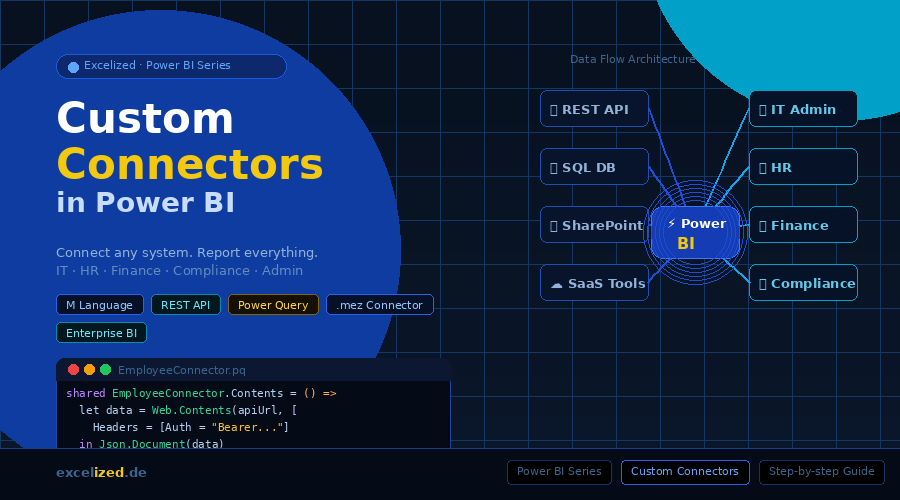
Power BI Custom Connectors: Unlock Analytics for Every Corner of Your Organisation
Go beyond sales reports — connect Power BI to your IT, HR, finance, and admin systems using custom connectors. A practical guide to unlocking organisation-wide analytics.
Most teams barely scratch the surface of what Power BI can do. Add custom connectors, and suddenly your IT, HR, finance, and admin workflows speak the same data language.
Power BI is well known for its clean dashboards and easy-to-read charts. But if you think of it only as a sales reporting tool, you are missing most of what it can actually do. The real power — no pun intended — comes when you connect it to the systems your entire organisation already runs on every day.
Custom connectors are the bridge that makes this possible. They allow Power BI to pull data from almost any source: internal APIs, niche SaaS tools, legacy databases, administrative platforms — anything that has no out-of-the-box connector. Once that bridge is in place, reporting becomes automatic, consistent, and available across every team.
This article walks you through what custom connectors are, how to build one step by step, and — most importantly — how to use them for the use cases most people never think about. Think IT operations, HR, compliance, facilities management, and more.
Check out some of our FREE templates and materials.
PRACTICE MATERIAL BELOW!👇
What Is Power BI — and Why Go Beyond Dashboards?
Power BI is Microsoft's cloud-based business intelligence platform. It connects to data, transforms and models it, and presents everything through interactive reports that anyone in your organisation can explore — no data science background needed. That accessibility is a big part of why it is so widely used.
The platform has three main components: Power BI Desktop (where you build reports), Power BI Service (the cloud layer where reports live and refresh automatically), and Power BI Mobile (for on-the-go access). They work together as one seamless ecosystem.
Most organisations use Power BI against one or two data sources — usually a SQL database or an Excel file. But the tool ships with hundreds of built-in connectors for platforms like SharePoint, Salesforce, Google Analytics, and Azure. And when those run out? That is exactly where custom connectors step in.
What Are Custom Connectors?
A custom connector is a plugin that tells Power BI how to authenticate and communicate with a specific data source. Think of it as a translation layer. Power BI speaks one language; your internal system speaks another. The connector bridges them — cleanly and securely.
Custom connectors are built using the M language, also called Power Query Formula Language. It is a functional language designed specifically for data transformation and query generation. The finished connector is packaged as a .mez file and placed in a designated folder on the user's machine, or deployed centrally via a gateway.
Once installed, it appears in Power BI Desktop's Get Data dialog right alongside the built-in options. For end users, it feels completely seamless. For the developer who built it, it is a powerful layer that handles authentication, pagination, error handling, and data shaping — all in one file.
💡 Good to know: Microsoft maintains an open-source community connector repository on GitHub. Before building from scratch, it is always worth checking whether someone has already done the work.
Building a Custom Connector — Step by Step
Let's build a connector that pulls employee records from an internal REST API. This is a realistic scenario for any HR or IT team — and the code below is original and fully adaptable to your own environment.
Step 1 — Define the connector and fetch data
section EmployeeConnector;

[DataSource.Kind="EmployeeConnector", Publish="EmployeeConnector.Publish"]
shared EmployeeConnector.Contents = () =>
    let
        baseUrl    = "https://api.yourcompany.com/v1/employees",
        response   = Web.Contents(baseUrl, [
            Headers = [
                #"Authorization" = "Bearer " & Extension.CurrentCredential()[Key],
                #"Accept"        = "application/json"
            ]
        ]),
        parsed     = Json.Document(response),
        asTable    = Table.FromRecords(parsed),
        typed      = Table.TransformColumnTypes(asTable, {
                        {"id",         type number},
                        {"name",       type text},
                        {"department", type text},
                        {"startDate",  type date},
                        {"status",     type text}
                     })
    in
        typed;
Step 2 — Configure authentication
EmployeeConnector = [
    Authentication = [
        Key = [
            KeyLabel = "API Token",
            Label    = "Provide your company API token"
        ]
    ],
    Label = "Company Employee API"
];
Step 3 — Handle pagination for large datasets
PaginatedFetch = (url as text, page as number) as table =>
    let
        pageUrl  = url & "?page=" & Number.ToText(page) & "&limit=100",
        raw      = Web.Contents(pageUrl, [
                       Headers = [
                           #"Authorization" = "Bearer " &
                           Extension.CurrentCredential()[Key]
                       ]
                   ]),
        json     = Json.Document(raw),
        records  = json[data],
        total    = json[totalPages],
        current  = Table.FromRecords(records),
        next     = if page < total
                   then Table.Combine({current, @PaginatedFetch(url, page + 1)})
                   else current
    in
        next;
Once you compile these files into a .mez package using the Power Query SDK in Visual Studio Code, drop it into this folder on your machine:
%USERPROFILE%\Documents\Power BI Desktop\Custom Connectors
Then enable trusted connectors in Power BI Desktop settings under Security. That's the entire deployment for a single user. For team-wide access, you deploy through an on-premises data gateway instead.
Real-World Use Cases Beyond Sales and Finance
This is where the story gets interesting. Custom connectors unlock Power BI for teams and tasks that rarely appear in typical BI guides. Here are five concrete examples.
1. IT Administration and Help Desk Monitoring
Connect Power BI to your ticketing system — Jira Service Management, ServiceNow, Freshdesk, or Zendesk — and get a real-time view of what your IT team is dealing with every day.
• Open vs. resolved ticket counts over time
• Average resolution time per agent or team
• SLA compliance rates and breach pattern detection
• Infrastructure uptime correlated with incident history
• Hardware and software asset inventory trends
Instead of weekly spreadsheet exports, your IT manager opens a live dashboard every morning. Issues surface before they become crises.
2. HR Analytics and Workforce Planning
Most HR platforms — BambooHR, SAP SuccessFactors, Personio, or Workday — have APIs. A custom connector pulls live workforce data directly into Power BI, replacing manual monthly reports.
• Headcount by department, office location, or cost centre
• Employee turnover and time-to-fill metrics
• Onboarding progress and completion rates
• Training hours, certifications, and learning compliance
• Absence and sick leave patterns by team
3. Compliance and Audit Reporting
Compliance work is notoriously manual. Custom connectors automate the entire data collection step, leaving your compliance team to focus on analysis rather than spreadsheet assembly.
• Active Directory access logs and role assignments
• Policy acknowledgement rates across departments
• GDPR data subject request tracking
• ISO or SOC audit evidence collection
• Certificate and licence renewal calendars
4. Facilities and Asset Management
Operations teams managing physical spaces and equipment rarely have good data visibility. A connector to your facilities management tool changes that entirely.
• Office space and hot-desk utilisation rates
• Equipment maintenance schedules and overdue items
• Asset depreciation timelines by category
• Vendor contract expiry alerts
5. Project and Budget Tracking for Admin Teams
Administrative teams often manage projects across tools that don't talk to each other. A connector to Monday.com, Asana, Planner, or even a SharePoint list brings it all into one place.
• Task completion rates across active projects
• Budget spend vs. allocation per cost centre
• Procurement timelines and supplier performance
• Event planning milestones and checklist status
Quick Start: REST API Without a Full Connector
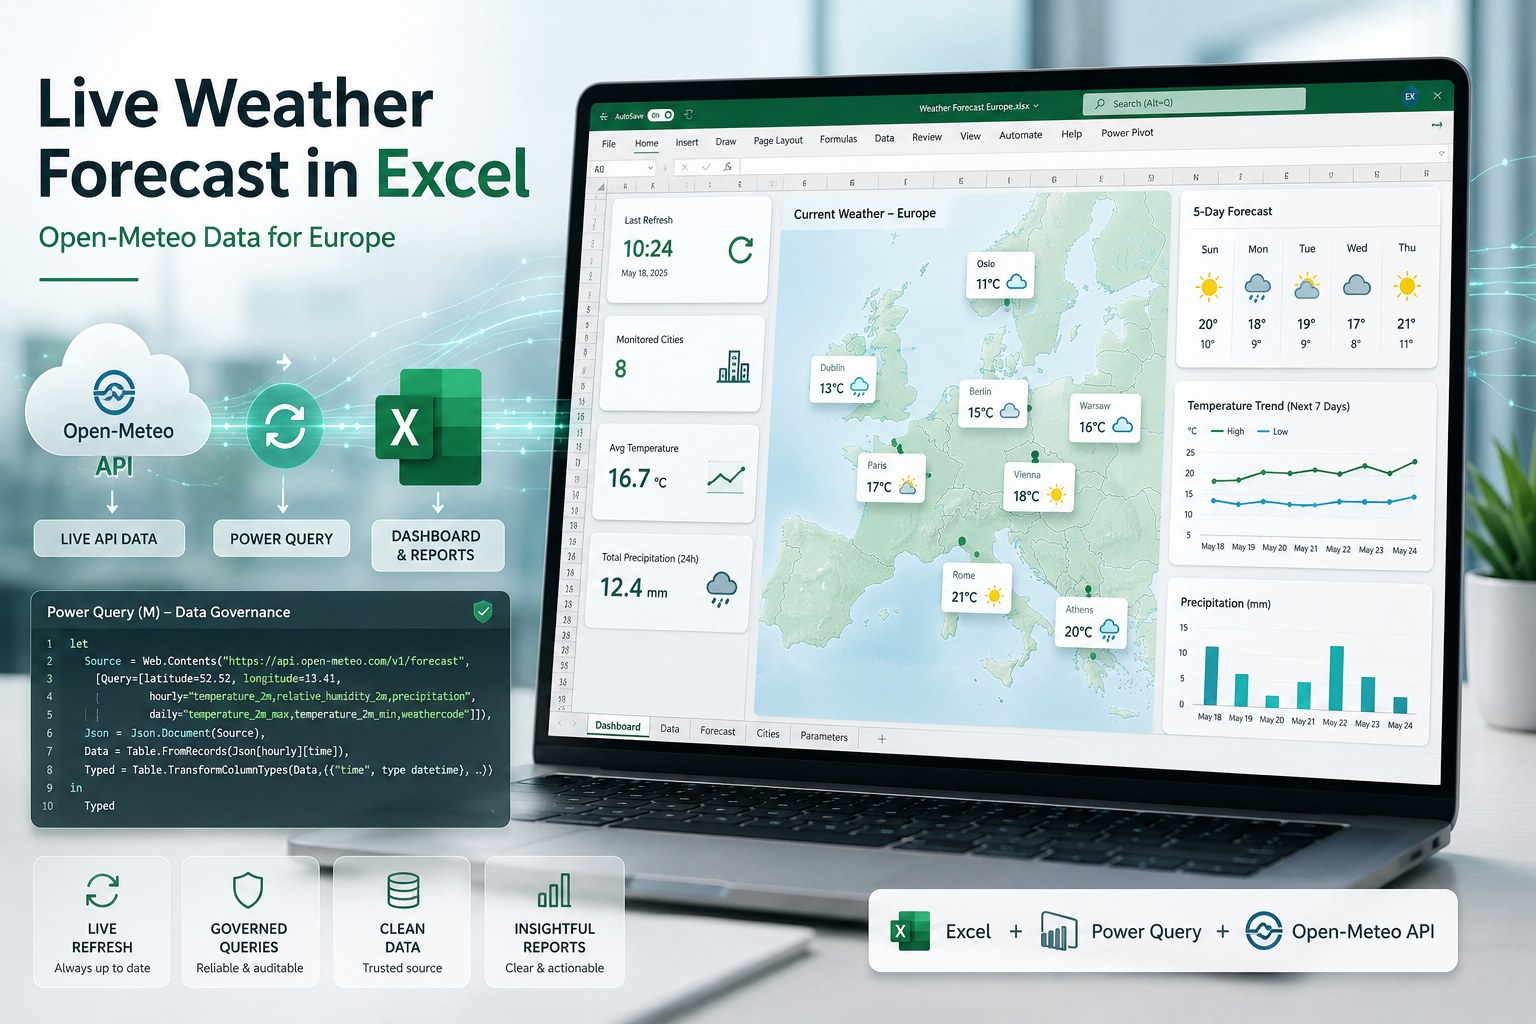
If building a full .mez connector feels like overkill for your situation, Power BI's built-in Web connector can query REST APIs directly using a short Power Query M script. No packaging required.
let
    apiUrl    = "https://api.example.com/admin/tasks",
    headers   = [
        #"Authorization" = "Bearer YOUR_API_KEY",
        #"Accept"        = "application/json"
    ],
    rawData   = Web.Contents(apiUrl, [Headers = headers]),
    parsed    = Json.Document(rawData),
    taskList  = parsed[tasks],
    asTable   = Table.FromList(
                    taskList,
                    Splitter.SplitByNothing(),
                    null, null,
                    ExtraValues.Ignore
                ),
    expanded  = Table.ExpandRecordColumn(
                    asTable, "Column1",
                    {"id", "title", "assignee", "status", "dueDate", "priority"},
                    {"Task ID", "Title", "Assignee", "Status", "Due Date", "Priority"}
                ),
    filtered  = Table.SelectRows(expanded, each [Status] <> "archived"),
    sorted    = Table.Sort(filtered, {{"Due Date", Order.Ascending}})
in
    sorted
This approach is perfect for prototyping a new report before committing to a full connector build. It also works well for smaller teams that need a quick integration without a full development cycle.
Best Practices for Building and Managing Connectors
A connector is code — treat it that way. These practices will save you significant time down the road.
• Version control everything: Store connector source files in Git. Tag every release. Maintain a changelog so you always know what changed and when.
• Handle errors gracefully: Use try...otherwise blocks in M to avoid silent failures in production reports. Users should always see a meaningful message, not a blank visual.
• Never hardcode credentials: Always use Power BI's built-in credential manager or Azure Key Vault references. Hardcoded tokens in source code are a serious security risk.
• Enable incremental refresh: For large data sources like IT logs or transaction histories, incremental refresh dramatically reduces query load and speeds up report updates.
• Document your connectors: A short README inside the connector project folder saves hours of debugging later — especially when someone else inherits the code.
• Use a shared gateway: For team-wide deployments, configure an on-premises data gateway so scheduled cloud refreshes work automatically for every user.
⚠️ Security note: When deploying via a gateway, only run connectors you own and control. Uncertified connectors bypass Power BI's standard validation checks.
Scheduling, Automation, and Alerts
Custom connectors don't just make one-time reports possible — they enable continuous, automated reporting. Once your connector is live in Power BI Service, you can schedule automatic data refreshes: every hour, every day, or at any custom interval. Your HR headcount report and your IT ticket backlog stay current without anyone lifting a finger.
Take it further by combining Power BI with Power Automate. You can set up alerts that trigger real-world actions the moment a metric crosses a threshold:
• Send a Teams message when open IT tickets exceed 50
• Email the facilities manager when a maintenance item is 7 days overdue
• Notify the compliance officer when policy acknowledgement drops below 90%
• Create a Planner task when a vendor contract is 30 days from expiry
This turns Power BI from a passive reporting layer into an active operational tool. Data doesn't just sit in a dashboard — it drives action.
Conclusion
Power BI is far more than a sales dashboard tool. With custom connectors, you can bring virtually any data source into a single, coherent reporting layer — one that serves IT, HR, finance, compliance, operations, and administration equally well.
The M language has a learning curve, but it is manageable. And the payoff is significant: less manual work, faster decisions, and a data culture that grows across your whole organisation rather than staying confined to one team.
Start small. Pick one internal system and build one connector. Publish one report. The second one will be twice as fast. And before long, you will have built something your entire organisation relies on every single day.
If you found this guide useful, explore the related posts below or download a free Power Query cheat sheet by subscribing to the Excelized newsletter.

👉 Want to build this yourself, live? Book a 1:1 Power BI Crash Course and learn it hands-on with me.
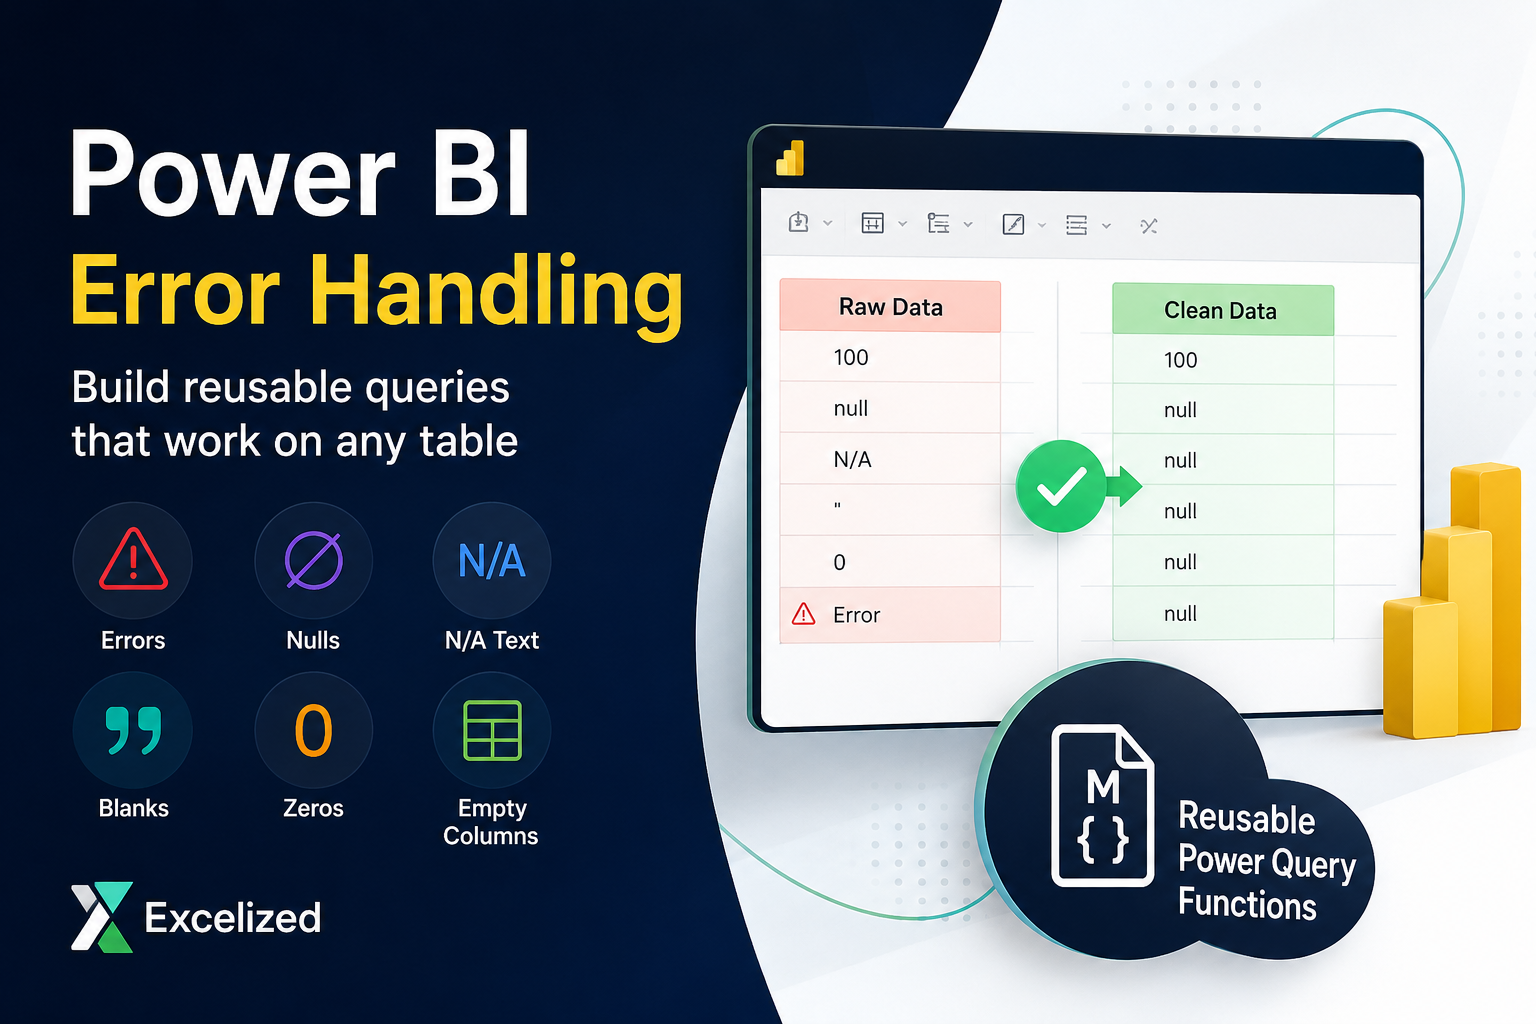
Power BI Error Handling: Build Reusable Queries That Work on Any Table
Read insight